FAQ - General
General questions about the platform.
What and who is BetterTrader good for?
BetterTrader is first and foremost an analysis tool.
You can also link your broker account and use it as a trading platform.
BetterTrader is useful for traders of FX (FOREX), Commodities, Indices and Futures. Our products are used by professional and beginner traders to gain an edge over the market, by harnessing artificial intelligence abilities in real-time.
The general Trading profile that is best suited to BetterTrader Trade Ideas is a trader that uses leverage and looks to profit from short term movements in the market. Short term market movements are defined as movements that happen in seconds, minutes and up until a couple hours.
BetterTrader provides two types of Trade Ideas:
1. Trade Ideas that are triggered by economic events.
2. Trade Ideas that are triggered by market movements.
More about how you can benefit from our Trade Ideas:
Many professional traders see our Trade Ideas as their own private team of analysts. The analysis our Artificial Intelligence algorithms do in one instant today, used to take professional teams of analysts working in large trading rooms many hours.
Our Artificial Intelligence algorithms analyze thousands of events every month, narrowing it down to only the most win-likely events. When using BetterTrader you will receive about three trade ideas per day for every market instrument you are interested in. Each trade idea is a market situation where back-testing shows a minimum of 66% historical win rate in similar market conditions.
Trade-Ideas are not meant as buy or sell recommendations. There are those Traders who might use our Trade Ideas as buy and sell recommendations, although this is not BetterTrader's intended usage as stated above. Rather you should see it as a complimentary tool that will cover all your analysis needs.
BetterTrader is strongly aligned with your interests as a trader because it is NOT a broker and maintains NO positions in the market. That is how we provide you with great analysis without any conflict of interest.
How can I get BetterTrader on my mobile or desktop device?
BetterTrader apps are cross-platform, meaning you can use them on more than one platform (e.g. mobile app and web). All of your settings are stored with your login username and password, so your preferences will be transferred automatically to any other platform you choose.
1. Android users please click here.
2. Iphone users please click here.
3. Desktop web users please click here. No download is necessary.
The following link runs directly in your web-browser.
Do you have a free trial period?
Yes. You can get full access to a pro subscription for a 7 day FREE trial period. No credit card is required to begin. BetterTrader Free trial is a great opportunity for professional and beginner Traders to see the great value you can get from the app. You might also learn some new Trading strategies along the way.
BONUS - After your 7 day free trial has ended, you will get another 7 day for free by signing up for one of the plans here
What is a recommended strategy for a beginner?
Open a free practice trading account and try some practice trades (no credit card necessary). This way you are not risking any capital without knowing what you are doing.
A practice account provides you with free virtual money so you can simulate trades without actually risking your capital.
When you create a BetterTrader account you automatically get login credentials for a free and unlimited trading practice account. This means that before you consider trading with your own real money you have the option to practice and learn how to use the application for free.
You can learn how the trading process works and test out different trading strategies at no cost. Thus you can simulate different trades and trading ideas through a real broker as if you had executed them with real money while you really are just trading imaginary money.
For more details on How to Practice Trading Without Using Real Money click here
Is BetterTrader an analysis platform or a trading platform?
BetterTrader is first and foremost an analysis tool.
BetterTrader can also be used as a trading platform by linking your broker account.
BetterTrader is useful for traders of FX (FOREX), Commodities, Indices and Futures. Our products are used by professional and beginner traders to gain an edge over the market, by harnessing artificial intelligence abilities in real-time.
The general Trading profile that is best suited to BetterTrader Trade Ideas is a trader that uses leverage and looks to profit from short term movements in the market. Short term market movements are defined as movements that happen in seconds, minutes and up until a couple hours.
BetterTrader provides two types of Trade Ideas:
1. Trade Ideas that are triggered by economic events.
2. Trade Ideas that are triggered by market movements.
BetterTrader is strongly aligned with your interests as a trader because it is NOT a broker and maintains NO positions in the market. That is why BetterTrader can provide analysis without any conflict of interest.
There is also the recommended option of linking your broker account and trading directly from within the app, so you don't need to switch between apps.
Additionally there is a free practice trading account which you can also use directly from within the app.

 Still need help ? Contact us
 Is there a guaranteed profit percentage?
BetterTrader does not guarantee any individual using BetterTrader Trade-Ideas as buy and sell recommendations any amount of success. BetterTrader does not attempt to predict the future.
No person or computer system can accurately predict the future. At best a person or computer system will be able to make an educated guess about the future, based on history.
The optimal usage of BetterTrader Trade Ideas stems from understanding what Trade-Ideas represent. Trade-Ideas pinpoint profitable market events and provide them along with their history and relevant analysis. Every Trader must decide on their own what the appropriate actions are that they wish to take.
Trade Ideas are a snapshot of the historical behavior for winning trades in similar situations.

 Still need help ? Contact us
 Where can I see statistics for all of your Trade Ideas?
The Trade Ideas we provide are snapshots of analysis, always remember that. Trade Ideas are used successfully by professional traders around the world.
Performance is a measure of how accurate a trader executes a plan, how disciplined, patient and diligent they are. For this reason performance is an individual measure and completely useless outside of that context.
But with a risk-free 7 day trial and the option for a free demo account, we encourage you to give our subscription a try and judge for yourself.

 Still need help ? Contact us
 FAQ - Markets
Questions about the Markets tab and its interfaces.
What is the Markets tab? Where is it located?
The Markets tab is a place where you can track and get price updates for any instrument that is traded in the markets.
The Markets tab has a menu with the following tabs:
-Positions - All of your open positions, (relevant only for those that have connected their broker account or have executed trades with the practice trading account).
-Watchlist - Any instrument you have added to your watchlist.
-Forex - Most popular Forex instruments.
-Commodities - Most popular Commodities instruments.
-Indices - Most popular Indices instruments.
-Bonds - Most popular Bonds instruments.
A globe symbol represents the market tab. See the image below.


 Still need help ? Contact us
 What is my Watchlist? What features do you provide for my Watchlist?
Your Watchlist is a tab located in the Markets menu. See Image below.

Watchlist shows all the market instruments you want to track in one place.
The features available for your Watchlist are:
MarketSense - Tailor-Made notifications about price movements for the market instruments you are interested in.
MarketWakeUp - Notifications about major events (volatility increased\new 6 hours high, etc.) that help you keep on the markets pulse. Now you can be sure you will never miss a trade opportunity again.
Tell us your preferences so we can provide you with the trade ideas that suit you best, Trade Ideas feed is connected to your watchlist.

 Still need help ? Contact us
 What are MarketWidgets used for?
MarketWidgets provide notifications for getting the alerts you need.
Traders typically watch multiple screens tracking various market instruments and their price changes. Not watching those screens even for one moment can cause traders significant losses or missed profit opportunities.
MarketWidgets are like having an assistant watch those screens instead of you, thus saving your time and money. MarketWidgets eliminate the need for multiple screens and price-tracking. You get notifications that alert you to any price changes or events you are interested in.
The currently available MarketWidgets are:
MarketSense - Tailor-Made notifications about price movements for the market instruments you are interested in.
MarketWakeUp - Notifications about major events (new high\ volatility increasing) that help you on the markets pulse. Now you can be sure you will never miss a trade opportunity again.

 Still need help ? Contact us
 What is MarketSense and how do I use it?
MarketSense is one of our MarketWidgets.
If you have entered a trade or you want to track price movements for a specific market instrument, MarketSense will provide you with the alerts you need.
You don't need to be glued to the screen or your phone constantly checking tape movement anymore!
Customization allows you to choose the market instrument, how many change move and direction up or down, that you want to get notified about.
Say for example that you are interested in knowing if the price of crude oil moves $1 up or down. Just set your preferences and voila, no more price watching.
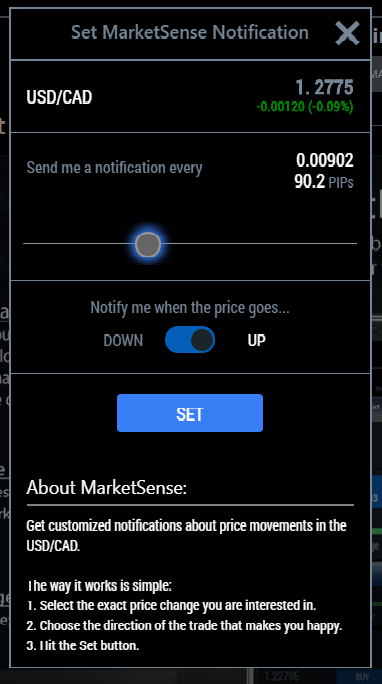
The way it works is simple:
1 Choose the market instrument you are interested in.
2 Select the exact price change you want to be notified about.
3 Choose the direction of the trade that makes you happy (up or down).
Receive a smiley face alert when your trade is working or a sad face alert in the adverse event.
MarketSense can be accessed from any place in the app that displays a specific market instrument or from the Watchlist.
MarketSense is represented by a glasses symbol. See image below.
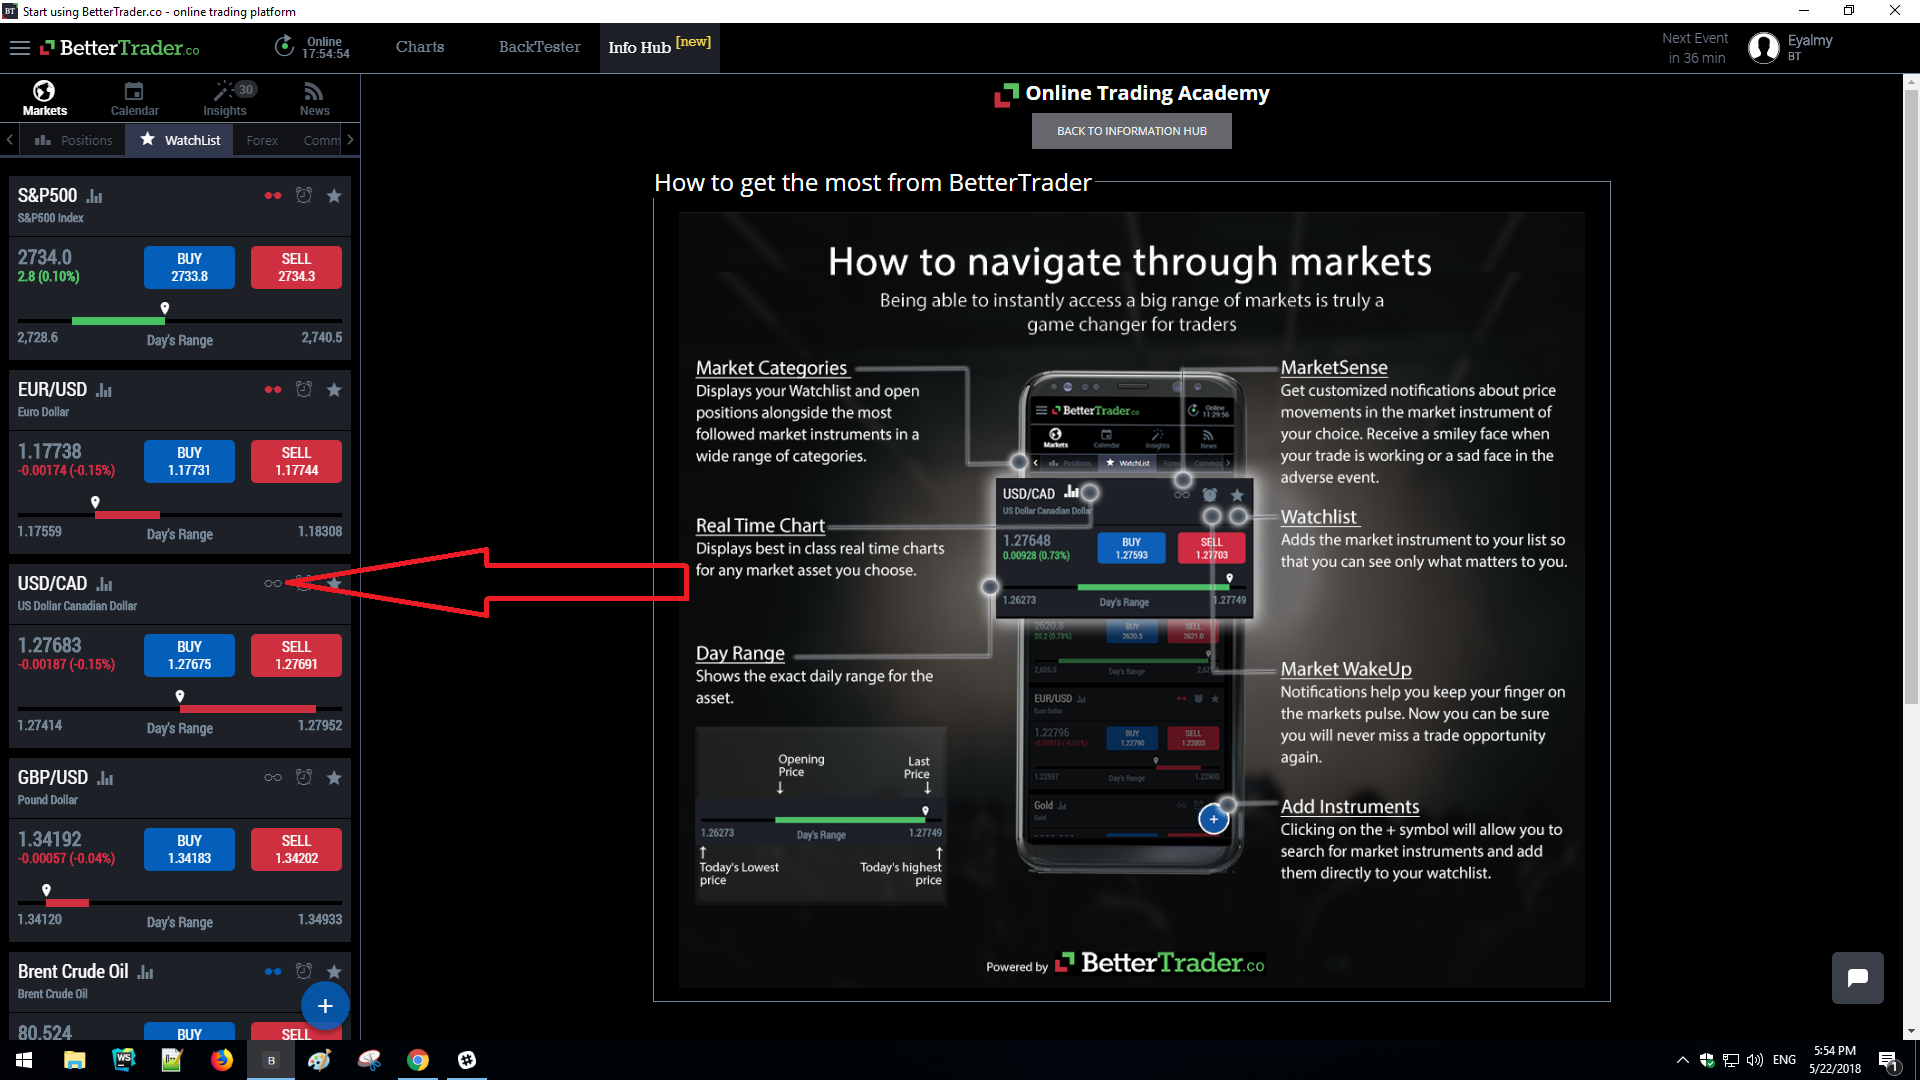
Here you can see how it looks once you click on it.

 Still need help ? Contact us
 What is MarketWakeUp and how do I use it?
MarketWakeUp is one of our MarketWidgets.
MarketWakeUp provides a great way to help you keep on the markets pulse.
Most of the time nothing major is happening in the market, but you need to know when something does happen. That is why Traders are constantly watching price movements even for market instruments that they are not trading. MarketWakeUp does that job for you. MarketWakeUp will send you alerts when volatility increases in a specific market instrument so you can be sure you will never miss a trade opportunity again.
MarketWakeUp can be accessed from any place in the app that displays a specific market instrument or from the Markets Watchlist sub tab.
MarketWakeUp is represented by an alarm clock symbol. See image below.
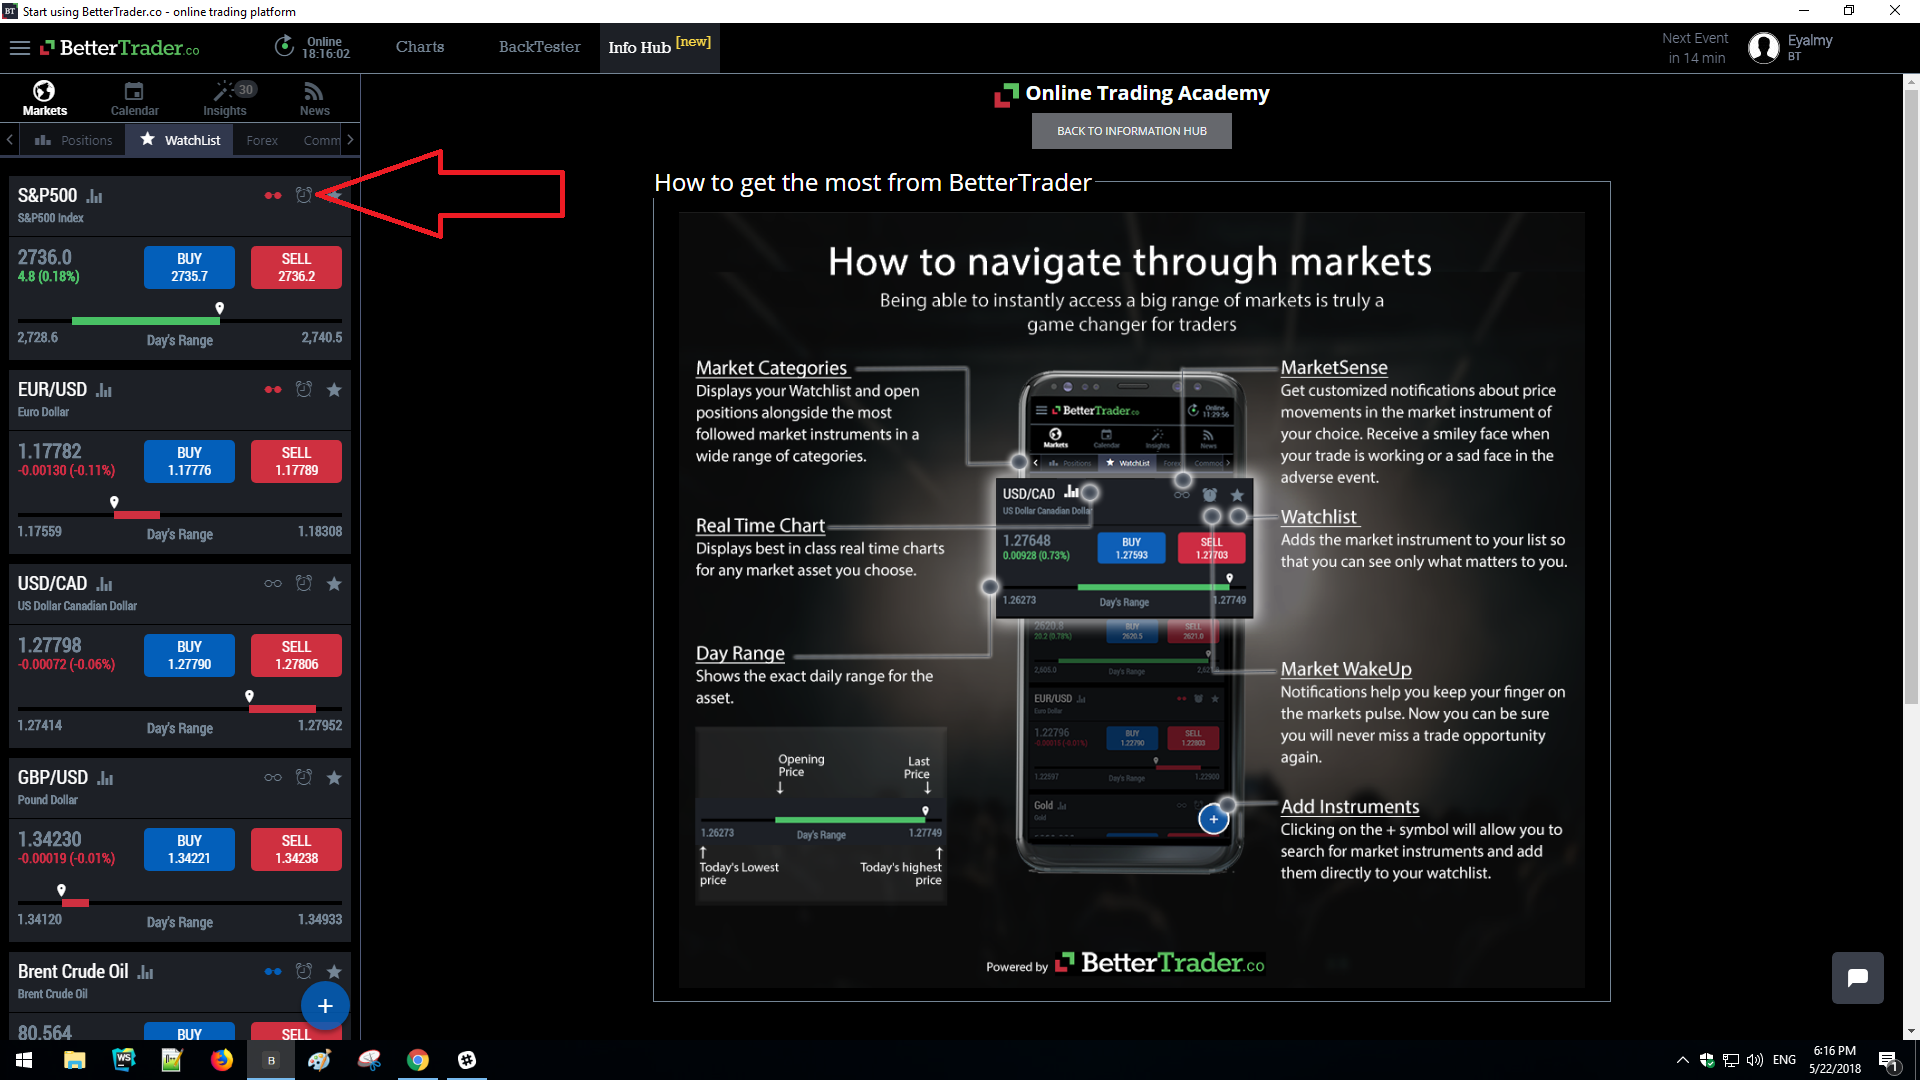
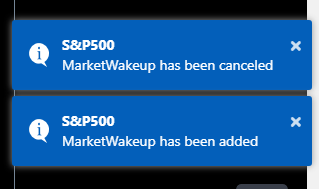
Here you can see how it looks once you click on it.

 Still need help ? Contact us
 How do I add/remove a market instrument to/from my WatchList?
There are two ways to add a market instrument to your Watchlist.
Option one:
If you see the market instrument in front of you and there is a star button on it. Just click on the star button.
See image below.

Now you have added the market instrument to your watchlist!
Option two:
From the apps main screen select the Markets menu.
It is represented by a globe symbol. See image below.

Now select the Watchlist tab.
It is represented by a star symbol
See the image below:
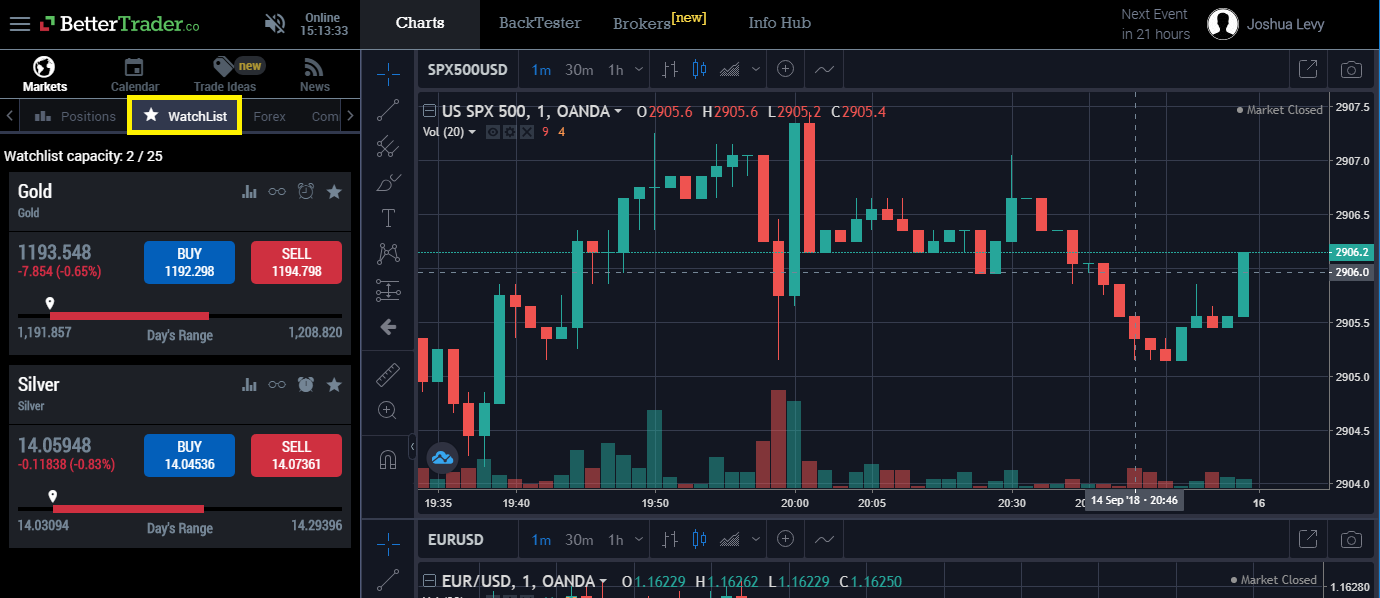
Now to add a market instrument to your watchlist you can click the plus symbol in the lower left hand side of the screen.
See the image below.
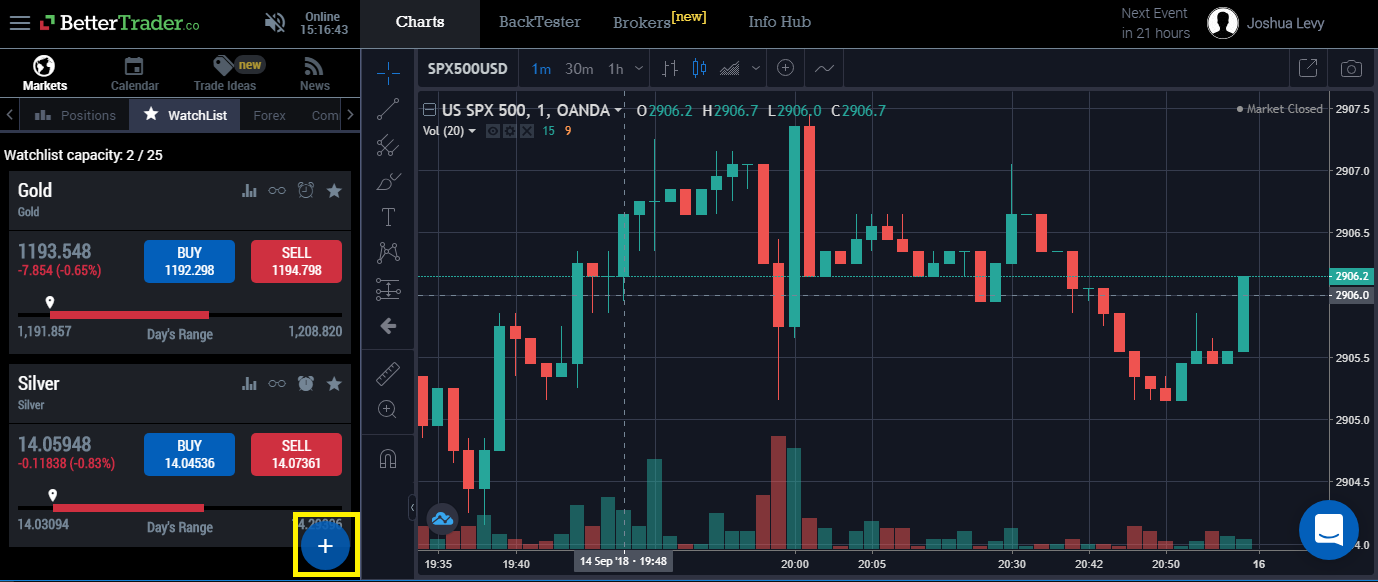
After you click on the plus symbol the screen in the image below will pop-up.
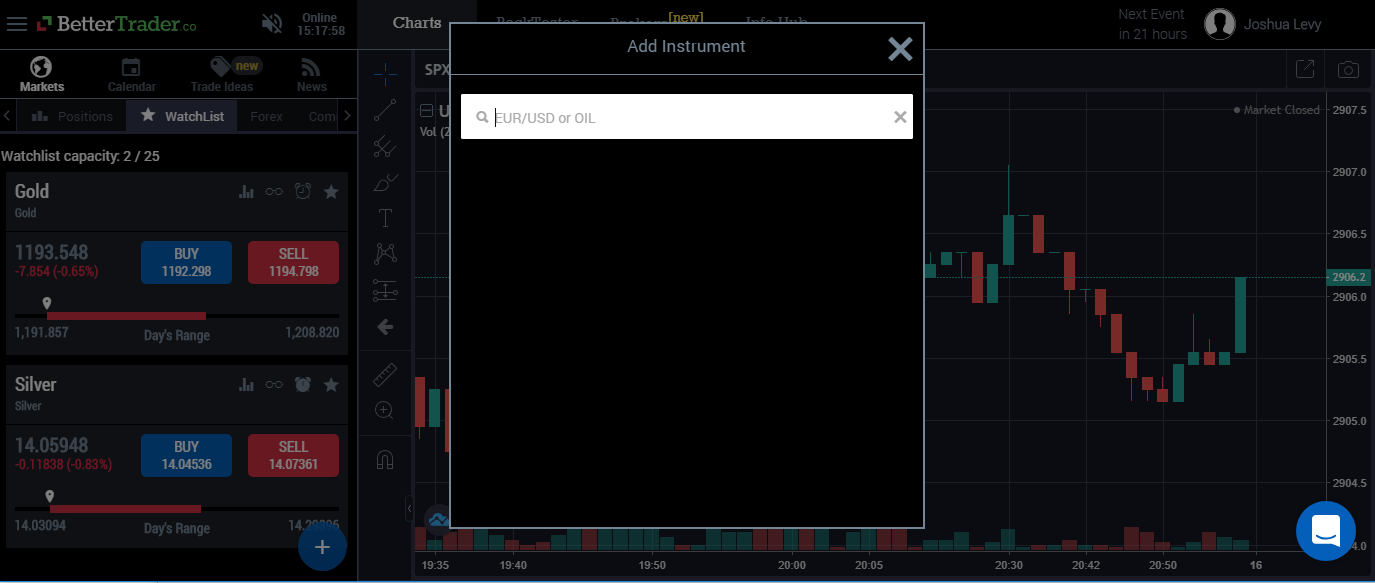
Now you can type in the market instrument of your choice and its name will appear in a drop down box.
See image below.
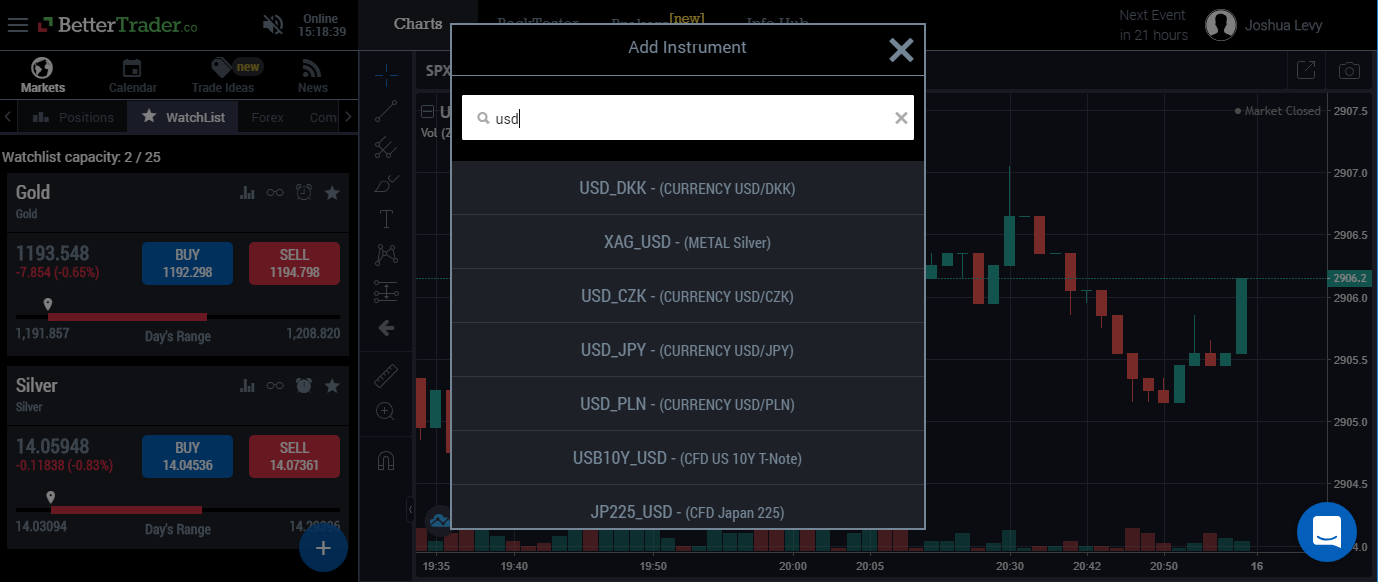
Click on it.
Now it has been added to your watchlist!

 Still need help ? Contact us
 FAQ - Economic Events
Questions about Economic Events and the features that can help you.
What is the Calendar and where can I find it?
Calendar tab displays all of the Economic Events from anywhere in the world, that have happened yesterday, are happening today or will happen tomorrow [such as Unemployment Rate, Interest Rate decisions, etc.]. For each and every economic event the calendar displays an event card.
The event card contains all the information about the event including the time and date, Actual number released, Previous number released, Analysts expectations, Magnitude of Surprise, Trade Ideas, Insights, Range for the past three years, Surprise range for the past three years and all Market Instruments related to the event.
Calendar tab is located underneath the menu button. A calendar symbol represents the calendar tab (see image below).

 Still need help ? Contact us
 What is a Economic Event or Indicator?
An economic indicator is a statistic that conveys certain information about economic activity. Economic indicators allow investors and traders to analyze the economic performance of a state, country or region, as well as make forecasts about future performance.
For example, each quarter the United States releases data on gross domestic product (GDP). This economic indicator allows investors to analyze the performance of the US economy over the previous three-month period, and make comparisons against the previous year. How fast the US economy grows can have a significant impact on market behavior.
Economic indicators are usually released by governments, international organizations and private research firms.
Click the link for our complete eBook explaining everything you need to know about Economic Events.
https://bettertrader.co/essential-guide-to-trading-economic-events/

 Still need help ? Contact us
 How can I profit from Economic Events?
Get familiar with the topic and prepare in advance for the Event, by gathering previous releases data and simulating different outcomes for the release.
At BetterTrader we provide traders with all the information after it has been prepared and analyzed by our Artificial Intelligence. All that is left for you to do is see the prepared data and make an educated decision.
For more on this topic please click the link to see our complete Economic Event eBook.
https://bettertrader.co/essential-guide-to-trading-economic-events/

 Still need help ? Contact us
 What is a Revision? Why does the number for "Prev" sometimes have a line through it and other times not?
Revision is official correction of the last number released for this event.
When there is a line through the "Prev" number it means that there has been a revision to the number previously released. Look for a number underneath stating what the revision is.

 Still need help ? Contact us
 What do the fields shown in each event represent?
Each event card brings you an extremely detailed snapshot containing:
1. All the past and present information regarding the Economic Event
2. Analysis regarding the Economic Event
3. How the event impacted the market in the past
4. How the event is likely to impact the market in the future.
For a detailed breakdown of all fields in the event card, please see the image below.
https://bettertrader.co/images/how-to-read-economic-event-the-basic-big.png.

 Still need help ? Contact us
 Why should I care about Economic Events?
The financial market’s volatility attracts many to follow and trade economic events and use this volatility to effectively generate profit. Economic events provide a source of volatility to the markets and therefore create numerous profitable trade opportunities. Unfortunately trading economic events without help isn’t easy. Starting from planning and preparing all the way through the releases, analyzing and trading economic events involves many steps.
Why economic events:
1. Economic Events are a source of volatility, therefore they provide great trading opportunities.
2. Economic Events are pre-scheduled, therefore we can prepare to trade them in advance.
3. Economic Events are recurring, therefore we can look at their history to predict future market movements.
For more on this topic please Click Here to see our complete Economic Event eBook.

 Still need help ? Contact us
 What is Magnitude of Surprise?
Trading opportunities are created by the market reacting to new information.
From an economic event perspective the difference between analyst expectations and the actual number for the release is the new information that will cause the market to react.
Magnitude of Surprise reflects how much the market is surprised by the actual release.
The categories we use are:
For stronger releases
1: A Bit Stronger (not expected to have any significant market impact because it is not a big surprise).
2: Stronger.
3: Much Stronger.
4: Extremely Stronger (a very big surprise that is likely to have a significant impact on the market).
For weaker releases
1:A Bit Weaker(not expected to have any significant market impact because it is not a big surprise).
2: Weaker.
3: Much Weaker.
4: Extremely Weaker (a very big surprise that is likely to have a significant impact on the market).
When the actual release is the same as analysts expected
1: As Expected.
Please see the detailed explanation here.

 Still need help ? Contact us
 What does the field that says "Impact" with varying numbers of exclamation marks represent?
Impact - Also known as importance in some economic event calendars. It represents how important this specific economic event is.
All economic calendar events have been categorized by our team of experienced traders, starting from events with the strongest impact on the market and ending with events that are not likely to have any market impact at all.
Three white exclamation marks represent events with information that every trader needs to know in order to avoid big surprises.
Two white exclamation marks represent events that most traders will look at and base their trade execution on.
One white exclamation mark represents an event with important information for general knowledge but not specifically for trading.
For example U.S. Existing Home Sales has three exclamation marks because it generally has a strong impact on the S&P 500 and USD/JPY. If home sales are down that means the economy is weaker so traders might be selling the S&P 500 or USD. So any trader that is active with the S&P 500 or USD must make sure he knows exactly what is happening with the U.S. home sales event.

 Still need help ? Contact us
 How can I see only the events that are relevant to me?
There are a couple different options to that allow you to display only those events that are most relevant to you:
1. Currency based filter:
If for example you trade the U.S. dollar. You can choose to filter events based on the Country\Currency so you would filter your calendar to include only those events that are in U.S. Dollars.
2. Impact based filter:
If for example you are only interested in events that are most likely to impact the market strongly. You can choose to filter your calendar to include only those events that are impact level three (most important events). The default and recommended setting is impact levels two and three.
How Do I Set It?
Clicking on the main menu button in the upper left hand corner will activate a sidebar menu. Click on the first item in that menu titled "Calendar Filter". This will bring up two options one titled "Currency" and the other "Impact".
- Clicking on "Currency" will allow you to choose which currencies to view in your calendar.
- Clicking on "Impact" will allow you to choose what level of impact you will view in your calendar.
Now your calendar will only display events that you care about.

 Still need help ? Contact us
 FAQ - Price Driven Trade Ideas
Questions about Trade Ideas that triggered by Price movements and patterns in the markets
What are Price Driven Trade Ideas?
Trade opportunities are created by the markets reaction to new information.
Price Driven Trade Ideas are for a specific market instrument based on it’s past movement in identical scenarios.
How Trade Ideas are calculated:
1. A interesting technical indicator is detected (e.g. “Five consecutive green candles”), and compared to it's last 20 instances (market instrument specific).
2. All market instruments are analyzed to determine which have adjusted the most in response to past instances.
3. Trade Ideas are filtered leaving only those that have historically shown profit at least 66% of all times in the last 20 instances that the indicator showed a significant movement (up or down, insignificant movements are not considered).
4. Entry price, stop loss and profit targets are determined on a very conservative basis.
Please see the image below for an example of a Price Driven Trade Idea. 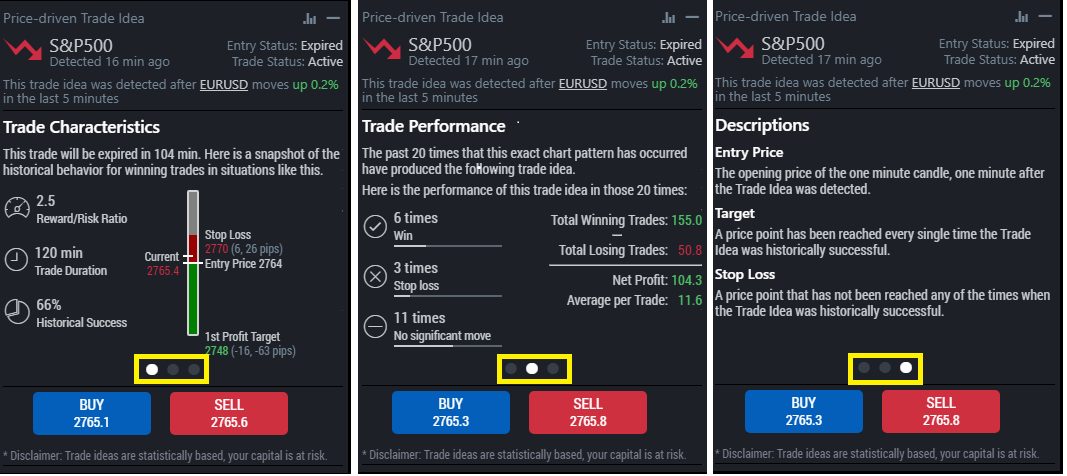

 Still need help ? Contact us
 How far do you back-test the history for Price Driven Trade Ideas?
Price Driven Trade Ideas:
With Price Driven Trade Ideas we get the latest information possible. Because it is important to know who is the market leader and follower right now, no one cares who the market leader was a year ago. That is why we back-test the market instrument up until we find 20 times where this exact event has happened or until one year, whichever comes first.
If there have not been 20 similar events in the past year we will not continue back-testing, because that data is likely irrelevant to the market conditions today.

 Still need help ? Contact us
 FAQ - Technical, setup, etc.
Step-By-Step setup guides.
How to manage mobile notifications?
Trade opportunities are created by the markets reaction to new information.
Price Driven Trade Ideas are for a specific market instrument based on it’s past movement in identical scenarios.
How Trade Ideas are calculated:
1. A interesting technical indicator is detected (e.g. “Five consecutive green candles”), and compared to it's last 20 instances (market instrument specific).
2. All market instruments are analyzed to determine which have adjusted the most in response to past instances.
3. Trade Ideas are filtered leaving only those that have historically shown profit at least 66% of all times in the last 20 instances that the indicator showed a significant movement (up or down, insignificant movements are not considered).
4. Entry price, stop loss and profit targets are determined on a very conservative basis.
Please see the image below for an example of a Price Driven Trade Idea. 

 Still need help ? Contact us
 how to manage emails?
Trade opportunities are created by the markets reaction to new information.
Price Driven Trade Ideas are for a specific market instrument based on it’s past movement in identical scenarios.
How Trade Ideas are calculated:
1. A interesting technical indicator is detected (e.g. “Five consecutive green candles”), and compared to it's last 20 instances (market instrument specific).
2. All market instruments are analyzed to determine which have adjusted the most in response to past instances.
3. Trade Ideas are filtered leaving only those that have historically shown profit at least 66% of all times in the last 20 instances that the indicator showed a significant movement (up or down, insignificant movements are not considered).
4. Entry price, stop loss and profit targets are determined on a very conservative basis.
Please see the image below for an example of a Price Driven Trade Idea. 

 Still need help ? Contact us
 how to set-up the basics in the app for best experience
Trade opportunities are created by the markets reaction to new information.
Price Driven Trade Ideas are for a specific market instrument based on it’s past movement in identical scenarios.
How Trade Ideas are calculated:
1. A interesting technical indicator is detected (e.g. “Five consecutive green candles”), and compared to it's last 20 instances (market instrument specific).
2. All market instruments are analyzed to determine which have adjusted the most in response to past instances.
3. Trade Ideas are filtered leaving only those that have historically shown profit at least 66% of all times in the last 20 instances that the indicator showed a significant movement (up or down, insignificant movements are not considered).
4. Entry price, stop loss and profit targets are determined on a very conservative basis.
Please see the image below for an example of a Price Driven Trade Idea. 

 Still need help ? Contact us
 FAQ - Customization and Preferences Setup.
Questions about In-App customization and preferences.
FAQ - BackTester
Questions about the BackTester tab
FAQ - Charts
Questions on the Charts tab and its features.
FAQ - Trade Ideas
Questions about the Trade Ideas concept and its interfaces.
If Trade Ideas are so awesome, why are you guys selling them? Why not just use them yourselves and get rich?
Trade Ideas are not a green – “buy”; red – “sell” black box system. They do not attempt to predict the future price of market instruments. They also do not replace a trader’s ability to manage risk in the form of money management, position sizing, trading psychology etc. Even professional trading rooms that have a dedicated team of analysts, are slowly but surely replacing those analyst teams with computing power. Trade Ideas are here to bring every trader the full power of a team of analysts.
Here are a few examples of what Trade Ideas are good for:
1. Showing traders which market instruments are correlated and how their relationship works (e.g. which instrument is the leader and which the follower, etc.).
2. Helping traders figure out which trades have a good chance of turning a profit.
3. Identifying which markets not to trade because of the absence of a clear statistical advantage.
Think of watching poker on TV, remember how they show you the odds of who has the better chances of winning? The information is not a guarantee of winning but it does give you a better idea of what to do – check, bet, or fold.

 Still need help ? Contact us
 What is the time-frame for the Trade Idea?
It is generally agreed upon that it takes up to 3 hours for the market to absorb new information, that is why we chose this time-frame for trade ideas.
If the trade idea has reached the stop loss or the profit target, you know the analysis is saying it is time to exit the trade.
If the trade idea has not reached the stop loss or the profit target, you should look at the Trade Duration field that appears on the trade card. See image below.


 Still need help ? Contact us
 What are Trade Ideas and how to read them?
Trade ideas are a summary of analysis for trade opportunities that are detected by BetterTrader's Artificial Intelligence Machine. You can see Trade Ideas as your personal team of analysts presenting you with the results of their analysis. Trade Ideas are not a guarantee of future events, no one can guarantee future events, nonetheless these are high-level analysis that bring you a historical perspective.
Trade Ideas supply the following:
1. Entry Price
2. Profit Target
3. Stop Loss
4. Reward/Risk Ratio
5. Historical Success Rate
6. Trade Duration
Trade Ideas are tested for a specific market based on it’s past movement in identical scenarios.
Minimum historical success rate - 66%
For more information please see https://bettertrader.co/online-trading-academy/info-hub/how-to-use-trade-ideas.html

 Still need help ? Contact us
 How long does a Trade Idea stay relevant to act upon?
Generally speaking Trade Idea's are relevant for up to three hours from their launch.
More specifically the Status fields in the Trade Idea card show you whether the Trade Idea is still relevant to act on.
Entry Status:
1. Active - means its still relevant to initiate the Trade Idea.
2. Expired - means do not initiate the Trade Idea.
Trade Status:
1. Active - means the idea is still active for those that have initiated it.
2. Expired - means if you have initiated the Trade Idea it is time to exit.
Entry Status generally changes to Expired ten minutes after the Trade Idea has been detected.
See image below for an example of Trade Idea Statuses. 

 Still need help ? Contact us
 All BetterTrader Trade Ideas have a minimum of 66% historical success rate, does that guarantee that I will be right 66% of the time?
No, the correct way to see it is as follows:
Based on the current performance, history in similar situations and the overall market conditions, all Trade Ideas have at least a 66% probability of being a winning trade.
That being said, past results never guarantee future performance. For example, when you flip a coin, betting on heads should win 50% of the time, but you can theoretically flip a coin any number of times and not win when betting on heads. It has no theoretical limit.
Nobody can predict the future, but you can play the odds.

 Still need help ? Contact us
 What should I do if a new Trade Idea opposes another Trade Idea that I have already initiated?
It is best to handle every Trade Idea by itself - not to enter two opposing trades. Sometimes you might get a Trade Idea to short EUR/USD and 20 min later a long EUR/USD Trade Idea. Generally speaking from a strategy perspective if you have already entered a trade, stick with the Stop Loss and Profit Target you initially defined and disregard the new Trade Idea.
After all its just statistics and you need to stick to one strategy - otherwise you commit the cardinal sin of over-trading.

 Still need help ? Contact us
 FAQ - Insights
Questions about the Insights tab and its interfaces.
FAQ - News Driven Trade Ideas
Questions about Trade Ideas that are triggered by Economic Events.
What are News Driven Trade Ideas?
Trade opportunities are created by the markets reaction to new information from economic events.
When Magnitude of Surprise is greater, the trade opportunity is likely to be greater as well.
Trade Ideas are for a specific market based on it’s past movement in identical scenarios.
How News-Driven Trade Ideas are calculated:
1. Magnitude of Surprise is determined (e.g. “Much Weaker”), and compared to all past releases for this event with an identical Magnitude of Surprise.
2. All market instruments are analyzed to determine which have adjusted the most in response to past releases for this event with an identical Magnitude of Surprise.
3. Trade Ideas must show profit at least 66% of the times that releases for this event:
3.1. Had an identical Magnitude of Surprise.
3.2. Occurred within the past three years.
4. Entry price, profit target and stop loss points are determined on a conservative basis.
Please see the image below for an example of a News Driven Trade Idea.

 Still need help ? Contact us
 What is the difference between Potential Trade Ideas before the event and Trade Ideas after the event?
Potential Trade Ideas are calculated before the event is released. It presents successful trades for a simulation of all the different possible outcomes for the event. Potential Trade Ideas recommended use is as a reference for which instruments might be a good idea to trade or not.
Trade Ideas are calculated at the moment of the event's release. It presents trades that are statistically successful based on back-testing of events with identical data. Trade Ideas are accurate and specific to the event's release and therefore present good trading opportunities.
In summary Potential Trade Ideas is good for preparing trades and knowledge before the event's release while Trade Ideas is good for knowing what to trade or not to trade once the event has been released.

 Still need help ? Contact us
 How can I profit from trading the news when there are algorithmic trading computer programs that are able to trade much faster than me?
BetterTrader's system is built so real people can profit from trading, not for Algorithm-Trading-Computers. Up to ten seconds from the event is the time-frame that Algo-Trading-Computers target for making their profit. That is why when we calculate historical data for Trade Ideas we skip the first minute after the release, to get a clean perspective not tainted by the “noise” of the Algo-Trading-Computers.

 Still need help ? Contact us
 How far do you back-test the history for News Driven Trade Ideas?
We back-test three years of data for News Driven Trade Ideas. This gives a good solid perspective on what happened in various outcomes for the economic event. Also the data from the past three years is much more relevant than data from 20 years ago. Market conditions are very susceptible to change, looking at what happened any longer then three years ago runs the risk of being irrelevant or even misleading.

 Still need help ? Contact us
 FAQ - Practice Account
Questions about Trade Ideas that triggered by Price movements
FAQ - Brokers
Questions about using your broker account with BetterTrader.
How Can I Practice Trading Without Using Real Money?
By using a demo account with virtual dollars and virtual transactions. For a detailed explanation on what this is and how to access it please follow the link here.

 Still need help ? Contact us
 Can I execute trades directly from within the BetterTrader app?
If you already have an account with a brokerage firm you can link your BetterTrader and broker accounts and trade directly from the app. Once your account is linked you can also execute BetterTrader Trade Ideas immediately as you see them from within the app.
Otherwise you can open a demo or real account with one of the brokers that we support directly from within the app.
Brokers that we support are listed in the main menu under "Connect Your Broker". See the image below for a screenshot of the main menu.

 Still need help ? Contact us
 What is a practice trading account?
A practice account provides you with free virtual money so you can simulate trades without actually risk your own money. For example you can simulate a BUY for OIL at $47 a barrel and have your transaction recorded as if you had actually bought it. At any given time you can check on the simulation, see your profit or loss and decide to BUY SELL or HOLD.
It is just like opening an account with a broker, depositing your hard-earned cash into the account and trading with it. Except here you have deposited no cash and cannot win or lose anything. It is your "sandbox" to practice trades and learn more about the market while tracking your performance.
Click Here for instructions on how to begin.

 Still need help ? Contact us
 How can I connect my free practice account?
You will need the login credentials we sent you when you first signed up. For a detailed step-by-step explanation please click the link below.
https://bettertrader.co/brokers/tradier/how-to-practice-trading-without-using-real-money.html

 Still need help ? Contact us
 What are the benefits of linking my BetterTrader account to my brokerage account? Why should I link my accounts?
1. The ability to handle everything from viewing a Trade Idea or Economic Event and through actually processing the trade from within the BetterTrader app.
2. No need to copy the stop loss and buy orders.
3. Avoid the hassle of multiple logins and or multiple screens.
4. There are promotions that we run with brokers that can save you money.
In summary if you would like to boost your ease and speed of use and save money, you should link your brokerage account to your BetterTrader account.

 Still need help ? Contact us
 Can I link my BetterTrader account to my broker account? How
can I check if my broker is supported?
Yes. You can link to accounts with any of the supported brokers.
Seeing as the list of supported brokers is constantly growing, you can always check the "Connect your broker" https://app.bettertrader.co/#/app/broker tab from the main menu (see image below) for the most up-to-date information. If your broker does not appear on the link [https://app.bettertrader.co/#/app/broker], you can request support from your broker or send us an email at info@bettertrader.co 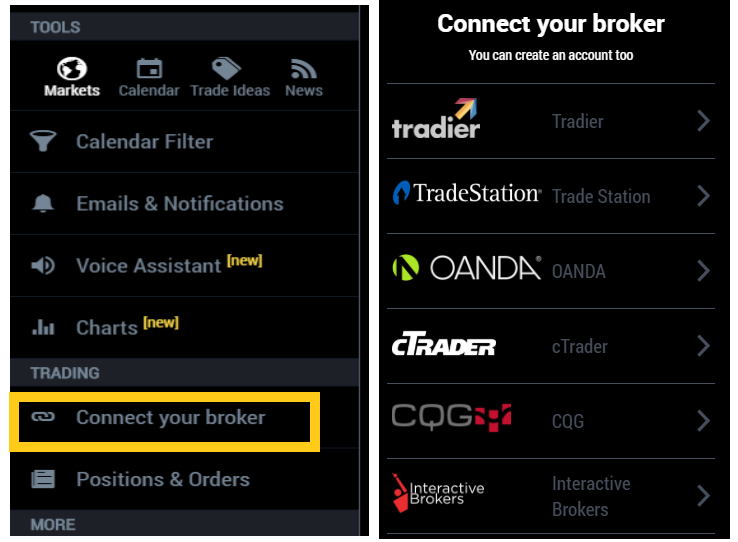

 Still need help ? Contact us
 How do I link my BetterTrader account to my brokerage account?
If you are a Tradier Brokerage user please Click Here for step-by-step instructions.
If you are a TradeStation user please Click Here for step-by-step instructions.
If you are a Oanda user please Click Here for step-by-step instructions.
If you are using a trading platform that is based on cTrader please Click Here for step-by-step instructions.
To see the most up-to-date lists on supported brokers please check the following links:
https://app.bettertrader.co/#/app/broker
https://bettertrader.co/partners.html

 Still need help ? Contact us
 My broker not working with you, can you connect?
If your broker does not appear on the link https://app.bettertrader.co/#/app/broker, please request from your broker that they email us at info@bettertrader.co . It is a very simple process for us to enable the option, but we need the request to come from your broker.

 Still need help ? Contact us
 Is BetterTrader a broker?
No, BetterTrader is an online analysis platform for economic events and market movements for traders and investors. We don't offer brokerage service, but you can use broker accounts to trade right from our platform.

 Still need help ? Contact us
 FAQ - Billing
Questions about Billing.
How do I cancel my subscription?
1: Click on the menu button in the upper left-hand corner.
2: Click on "Subscription".
3: Click on "Cancel my subscription".
It is easy to cancel, we do not hold anyone hostage.
It has happened that traders have lost money on a trade and immediately cancelled their subscription. This shows that those traders have misunderstood the nature of trading successfully. Trading is not about reacting to your emotions, it is about staying calm and collected and making conscious logical decisions.

 Still need help ? Contact us
 What is your cancellation policy?
Your cancellation will go into effect beginning with the next billing period. For a monthly subscription - beginning from the next month, for a yearly subscription beginning from the next year.

 Still need help ? Contact us
 What should I do if I am not satisfied with my BetterTrader subscription?
We are committed to excellent customer care and are interested in any issues that you would like to share. Email your concerns to us at info@bettertrader.co and we will do everything we can to ensure your satisfaction.

 Still need help ? Contact us
 What is the Advanced plan - what is the difference between Free, Basic and Advanced?
The plan breakdown is as follows:
FREE:
1: Economic Calendar
2: Real-time Market
3: Notifications
4: RSS
This plan is good for tracking economic events. It doesn't make any use of our advanced Artificial Intelligence platform and does not maximize the value we have to offer.
BASIC:
1: Includes everything in the FREE version plus:
2: Statistically back-tested Trade Ideas
3: Real-time Magnitude
4: Insights
5: Mobile and Web
This plan gives you greater insight into what actually happened, puts it into historical perspective and tells you what happened in the market following similar events. It is like your private team of analysts, getting you all the information you need in order to make informed decisions. Additionally you get
ADVANCED - MONTHLY
1: Includes everything in the BASIC version plus
2: BackTester
3: Real-time Reaction
This plan allows you to prepare in advance for all outcomes of the release.

 Still need help ? Contact us
