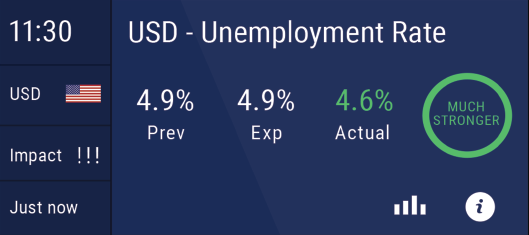
Magnitude of Surprise

Trading opportunities are created by the market reacting to new information.
From an economic event perspective the difference between analyst expectations and the actual number for the release is the new information that will cause the market to react.
Magnitude of Surprise reflects how much the
market is surprised by the actual release.

Generally speaking a STRONGER reading should be taken as a positive indication for the currency where the event has taken place . A WEAKER reading should be taken as a negative indication for said currency.
We categorize every instance of an event by calculating the difference between analyst expectations and actual results for the event in its total available history.
The categories we use are
For stronger releases
- A Bit Stronger (not expected to have any significant market impact because it is not a big surprise).
- Stronger.
- Much Stronger.
- Extremely Stronger (a very big surprise that is likely to have a significant impact on the market).
For weaker releases
- A Bit Weaker(not expected to have any significant market impact because it is not a big surprise).
- Weaker.
- Much Weaker.
- Extremely Weaker (a very big surprise that is likely to have a significant impact on the market).
When the actual release is the same as analysts expected
- As Expected.
Stronger (positive for the economy)
When Magnitude of Surprise is stronger it means the indication for the region/currency of the event is positive (Bullish).
Generally speaking when an actual number is higher than analysts expected that should be taken as a POSITIVE indication for the region/currency where the event has taken place.
Weaker (negative for the economy)
When Magnitude of Surprise is weaker it means that the indication for the region/currency of the event is negative (Bearish).
Generally speaking when an actual number is lower than expected that should be taken as a NEGATIVE indication for the region/currency where the event has taken place.
Example of a positive indication
Analysts were expecting GDP to be 3% and the Actual release was 5%. GDP is much higher than analysts expected, a very positive indication for the economy where the event took place. In this hypothetical case Magnitude of Surprise would show “Extremely Stronger”.
Example of a negative indication
Analysts were expecting GDP to be 5% and the Actual release was 3%. GDP is much lower than analysts expected, a very negative indication for the economy where the event took place. In this hypothetical case Magnitude of Surprise would show “Extremely Weaker”.
An important side note
It is true that generally speaking a higher actual number is a positive for the economy (therefore Magnitude of Surprise will show a reading in the “stronger” range).
However there are events that do not follow this general trend, events where a lower number represents a positive indication for the economy (resulting in Magnitude of Surprise with a reading in the stronger range) and a higher number represents a negative indication for the economy (resulting in Magnitude of Surprise with a reading in the weaker range).
An example of Magnitude of Surprise in action
Analysts were expecting the unemployment rate to be 5% and the actual release was 4%.This means the economy is doing much better than analysts expected because less unemployment means a stronger economy.
In this hypothetical case Magnitude of Surprise would show “Extremely Stronger” because it is a positive for the economy (even though the actual number was lower than expected).
In the opposite scenario if the unemployment rate was higher than analysts expected Magnitude of Surprise would show “Extremely Weaker” because more unemployed means the economy is weaker than expected.
Magnitude of Surprise is here to tell us if the actual number is a big or little surprise and if it was a positive or negative surprise. Magnitude of Surprise works in two stages.
In the first stage Magnitude of Surprise takes into account all the available historical data for the event and calculates the difference between expectations and actual results for each and every instance of the event.
In the second stage Magnitude of Surprise takes the range of difference between the expected and actual data and creates an average difference between them.
Once it has the average difference it calculates how close this events expected and actual were to that average.
In order to further understand this let's look at a simple example with very little data.
Let's assume we had only six instances of the event (this is not likely to be the actual case because the historical data is usually available for a couple decades back).
Additionally let's assume the expected and actual numbers were as follows
Expected: 1, 2, 3, 3 , 4
Actual: 2, 3, 3.5, 4.5, 6
As we can see the difference in the first number pair where expected was 1 and actual was 2 is 1. The same difference of 1 goes for the second pair (expected was 2 and actual was 3), therefore a difference of 1 between the actual and expected is not a big surprise to the market.
So in the third pair where the expected number was 3 and the actual number was 3.5 , Magnitude of Surprise would show "a bit stronger". In the fourth pair expected was 3 and actual was 4.5 (surprise of 1.5) that would be "stronger".
In the fifth number pair expected was 3 and actual was 6 (surprise of 1.5) that would be "much stronger".

