Decade Low European Unemployment: Making Educated trades to maximize profits and minimize risks
The recent release of the European unemployment rate was the lowest it has been in a decade. With an expected rate of 7.6% and actual of 7.5% this represented a much stronger than expected release. But understanding the effect in real-time of the unemployment rates can be difficult for even the most experienced traders. The lower unemployment rate is representative of the recovery Europe has been making from the Great Recession and the debt crisis that threatened the euro earlier in the decade. A fundamental to trading regarding this information requires an understanding of the global, local, and past affects the unemployment rate has had on the market. To see how we at BetterTrader compile this information to educate you as a trader read below.
The recent release of the European unemployment rate was the lowest it has been in a decade. With an expected rate of 7.6% and actual of 7.5% this represented a much stronger than expected release. But understanding the effect in real-time of the unemployment rates can be difficult for even the most experienced traders. The lower unemployment rate ... is representative of the recovery Europe has been making from the Great Recession and the debt crisis that threatened the euro earlier in the decade. A fundamental to trading regarding this information requires an understanding of the global, local, and past affects the unemployment rate has had on the market. To see how we at BetterTrader compile this information to educate you as a trader read below.
7.5% unemployment rate
10 year low (12.1% in (02/2013)
Overview
The european unemployment rate has been decreasing since the Great Recession and debt crisis which brought it to a high of 12.1% in February 2013. This decrease is a result of the increased efforts to improve the economy by lowering interest rates as well as the European Central bank setting a negative 0.4% on deposits it takes from commercial banks. This penalty was designed to promote banks to lend money.
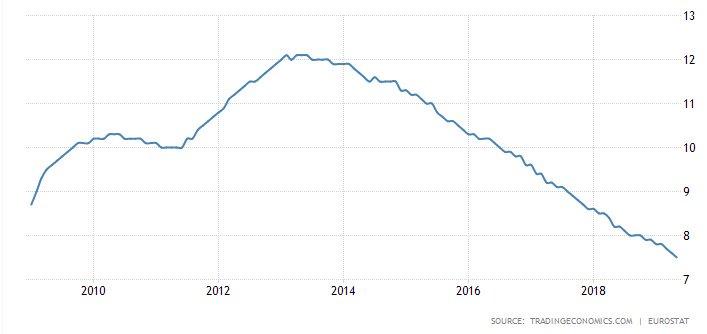 Fig. 1: The trend of European unemployment rate over the last decade
 Source: tradingeconomics.com
The recent release of the European unemployment rate (see Fig. 2, click to enlarge the image) was the lowest it has been in a decade. With an expected rate of 7.6% and actual of 7.5% this represented a much stronger than expected release.
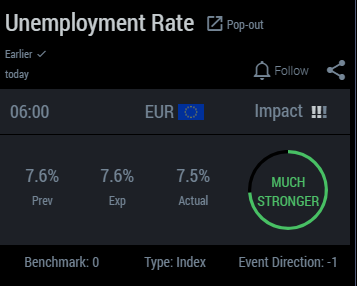 Fig. 2: EUR unemployment release
 Source: BetterTrader.co
The result is a decrease in the EUR/GBP currency pair. As shown (see Fig. 3, click to enlarge the image) the immediate effect of the release at 6:00am had an increase in the currency pair but within 20 minutes it had returned below the entry point. After that point, the pair continued to drop so a trader that shorted the position before that point would be able to defend themselves and continue with little to no pain.
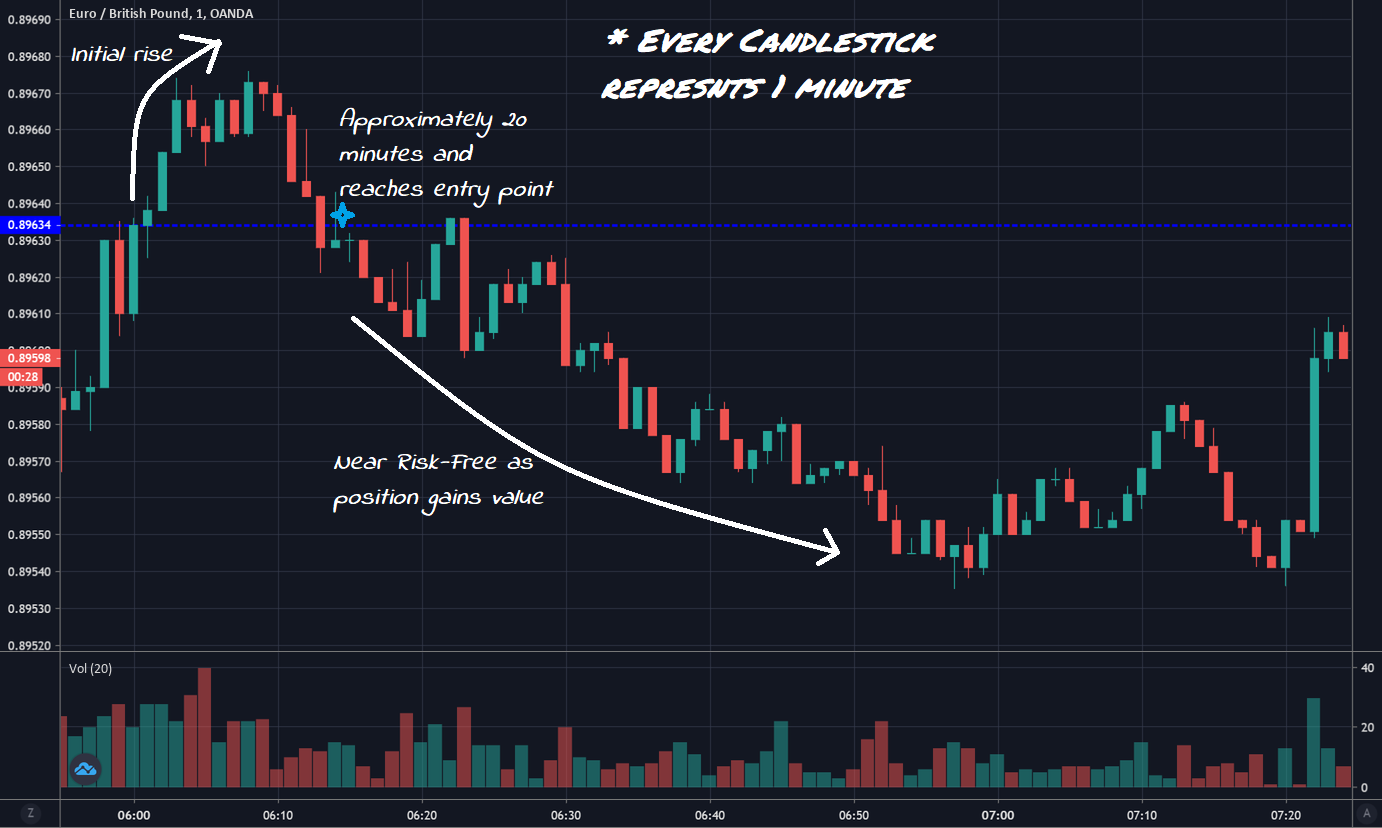 Fig. 3: Graph following EUR/GBP for an hour after the release
 Source: Trading View
The Problem
Being prepared for the release of the unemployment rate would allow you to make a decision as to whether or not you are going to take on the new position. The issue is that even though you are prepared a few things can still occur. If during the first 20 minutes after the release you opened a short position you would find that you were losing money and may have closed the position to prevent loss. Alternatively, if you had waited to open the position you would have missed a profitable entry position. To give you some ease it is best to look at historical trends and past data to better understand how the market will digest the new information.
So how can we be ready before the release?
A key factor in market movements are macroeconomic events. An educated trader one must be ready to react to any changes in the economy as quickly and efficiently as possible. This allows us to minimize risk and maximize profits.
By utilizing the BackTester you can prepare for the release of the information, get an idea for what possible positions you can open, and understand where a reasonable stop loss should be as well as the profit target. Let’s walk through it together.
Looking at the interface can seem challenging but I am going to show you exactly what you should be looking for.
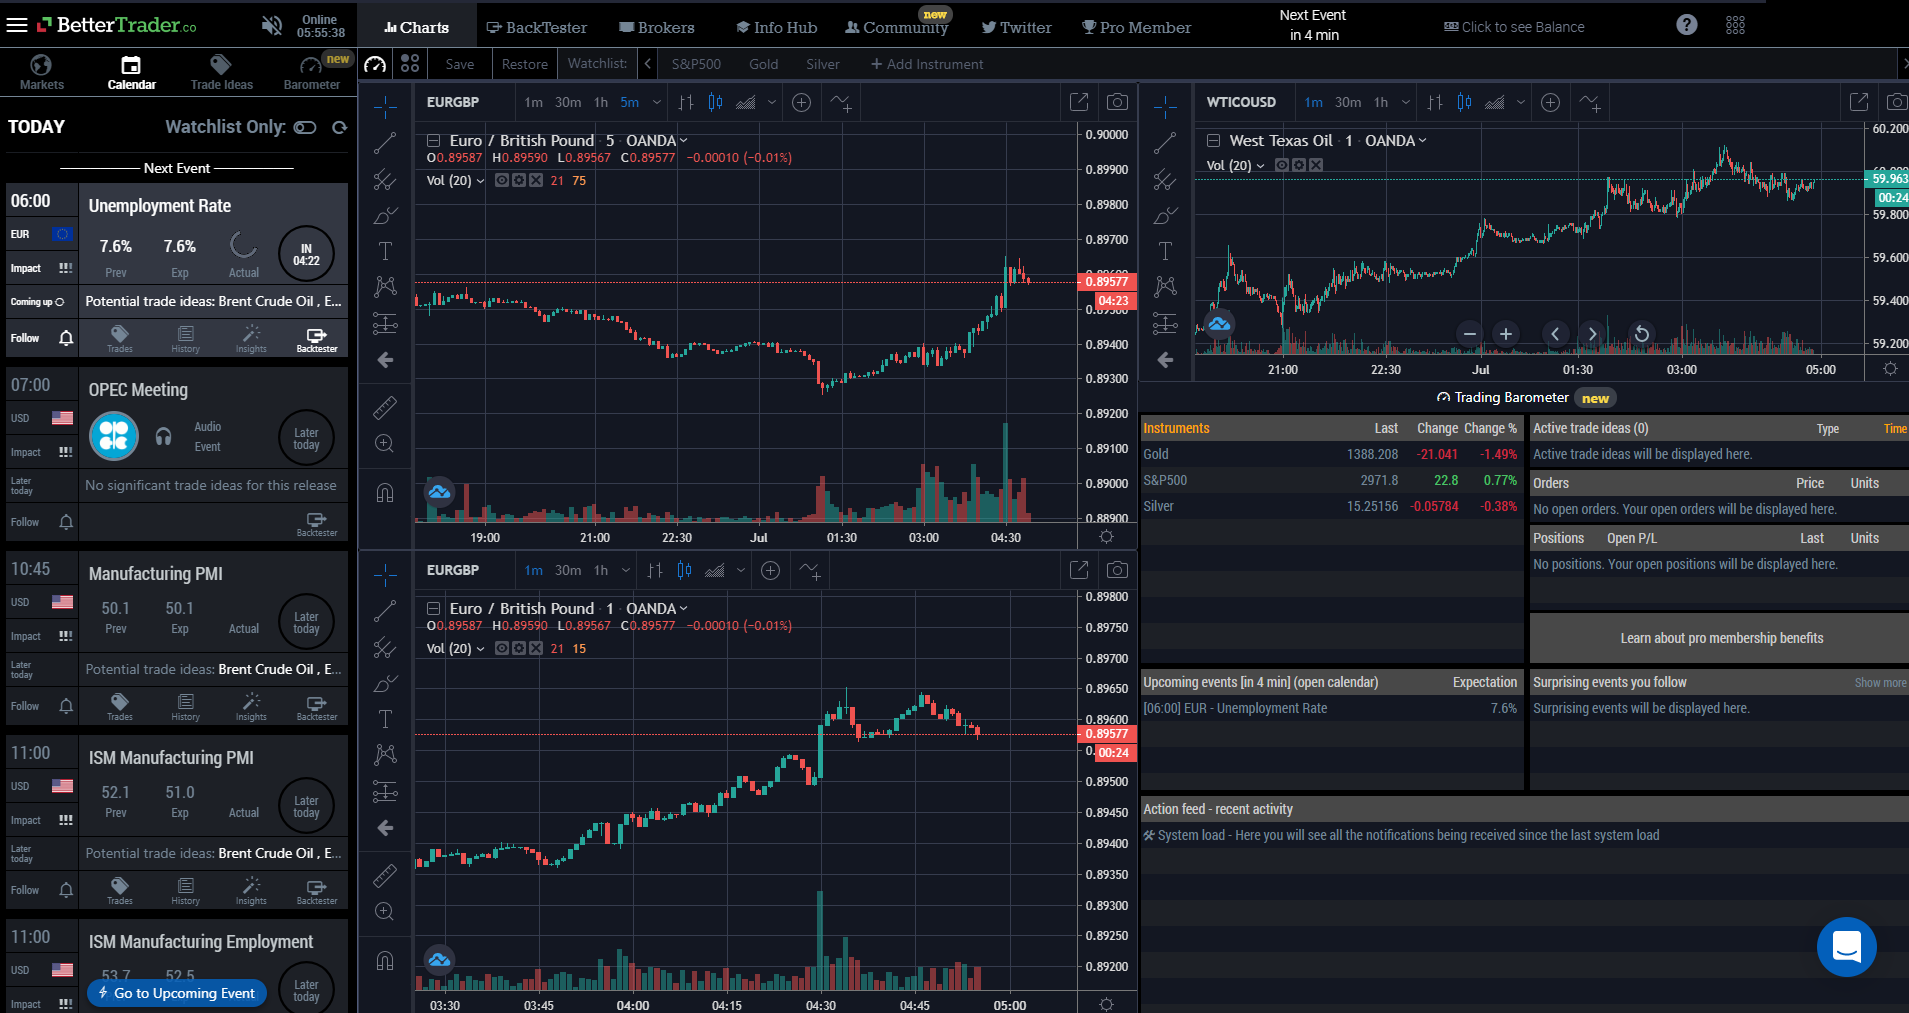 Fig. 4: BetterTrader Interface
 Source: BetterTrader.co
On the left we have the economic calendar that lists the different events that are going to be happening paired with their respective times.
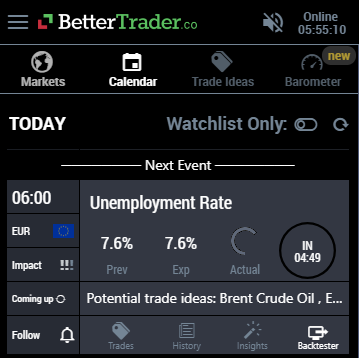 Fig. 5: Calender of events
 Source: BetterTrader.co
Among these events we are going to be focusing on the European unemployment rate release. In this case it is the next event and located at the top of the list.
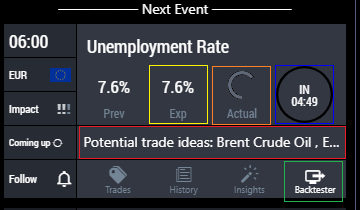 Fig. 6: Detailed eur unemployment event prerelease
 Source: BetterTrader.co
Firstly, notice the time to release marked in blue. The unemployment rate will be publicly released in 4 minutes and 49 seconds so we better hurry to prepare!
The actual value, marked in orange, is the data point we are waiting to trade against.
The potential for trading is going to be based on the comparison between the expected, marked in yellow, and the actual values.
By clicking on the BackTester, marked in green, we can explore the trade ideas that are marked in red.
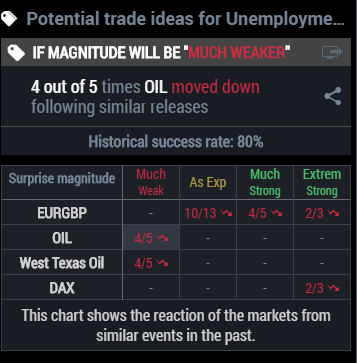 Fig. 7: Eur Potential Trade Ideas
 Source: BetterTrader.co
This is the list of potential trade ideas that is compiled for you. By clicking on any of the options, much weaker, as expected, much stronger, or extremely stronger we are given the charts and diagrams for the respective trade idea as it has occurred in the past. The chart shows different instruments that have been impacted by previous releases of this information and what potential exists for those instruments.
If the release is much weaker then shorting both Oil and West Texas Oil are ideas but if it had been stronger or extremely stronger than shorting EURGBP would be the trade idea.
Here is what happened if you clicked the 4/5 in line with the much stronger and EURGBP.
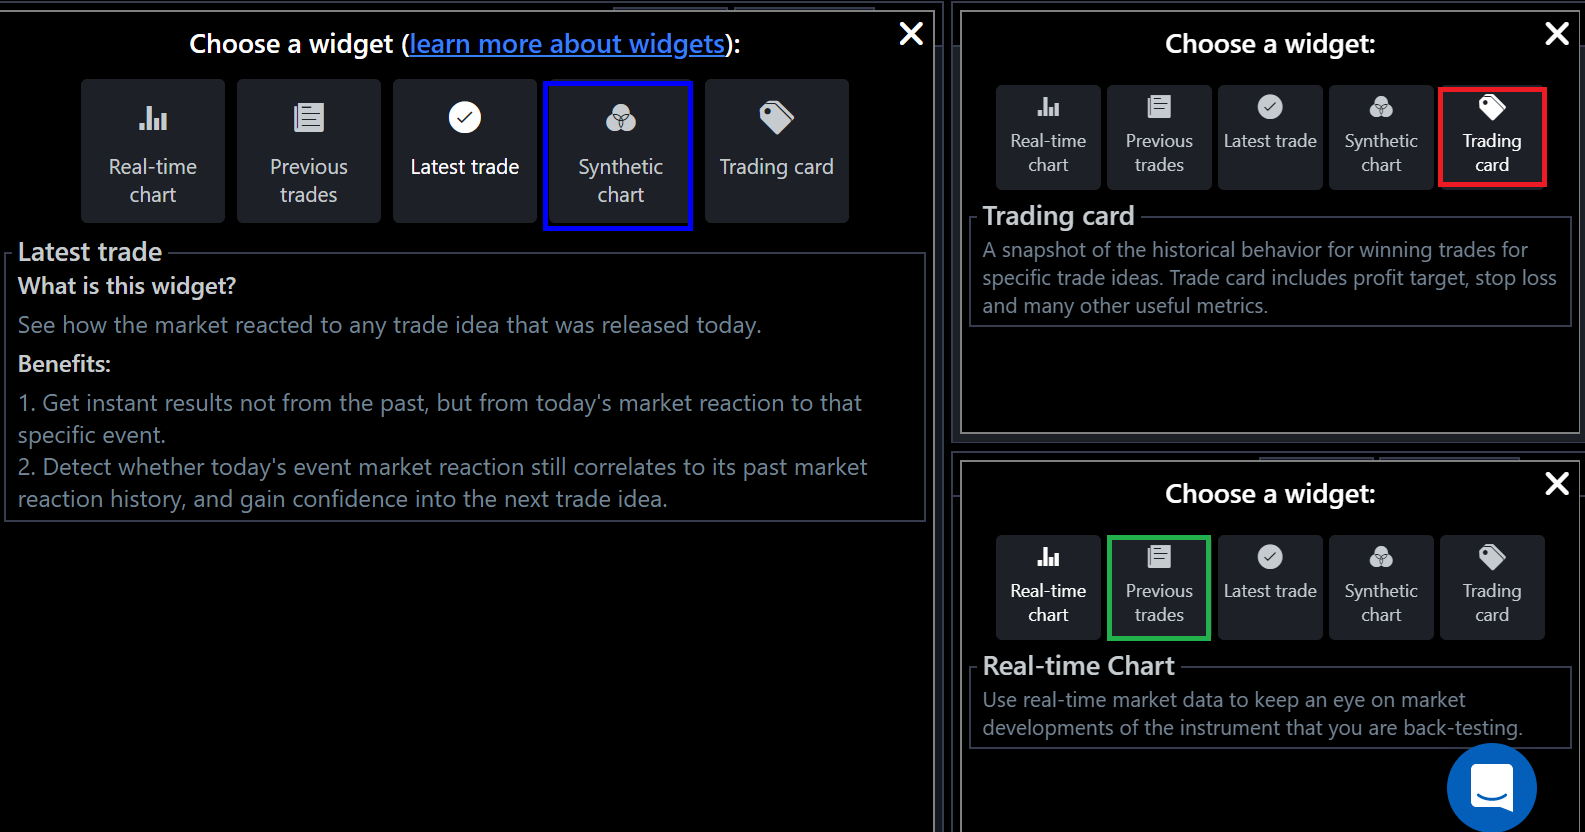 Fig. 8: Backtester setup
 Source: BetterTrader.co
Opening the synthetic chart in the center, marked in blue, the trading card in the top right, marked in red, and the previous trades in the final box, marked in green.
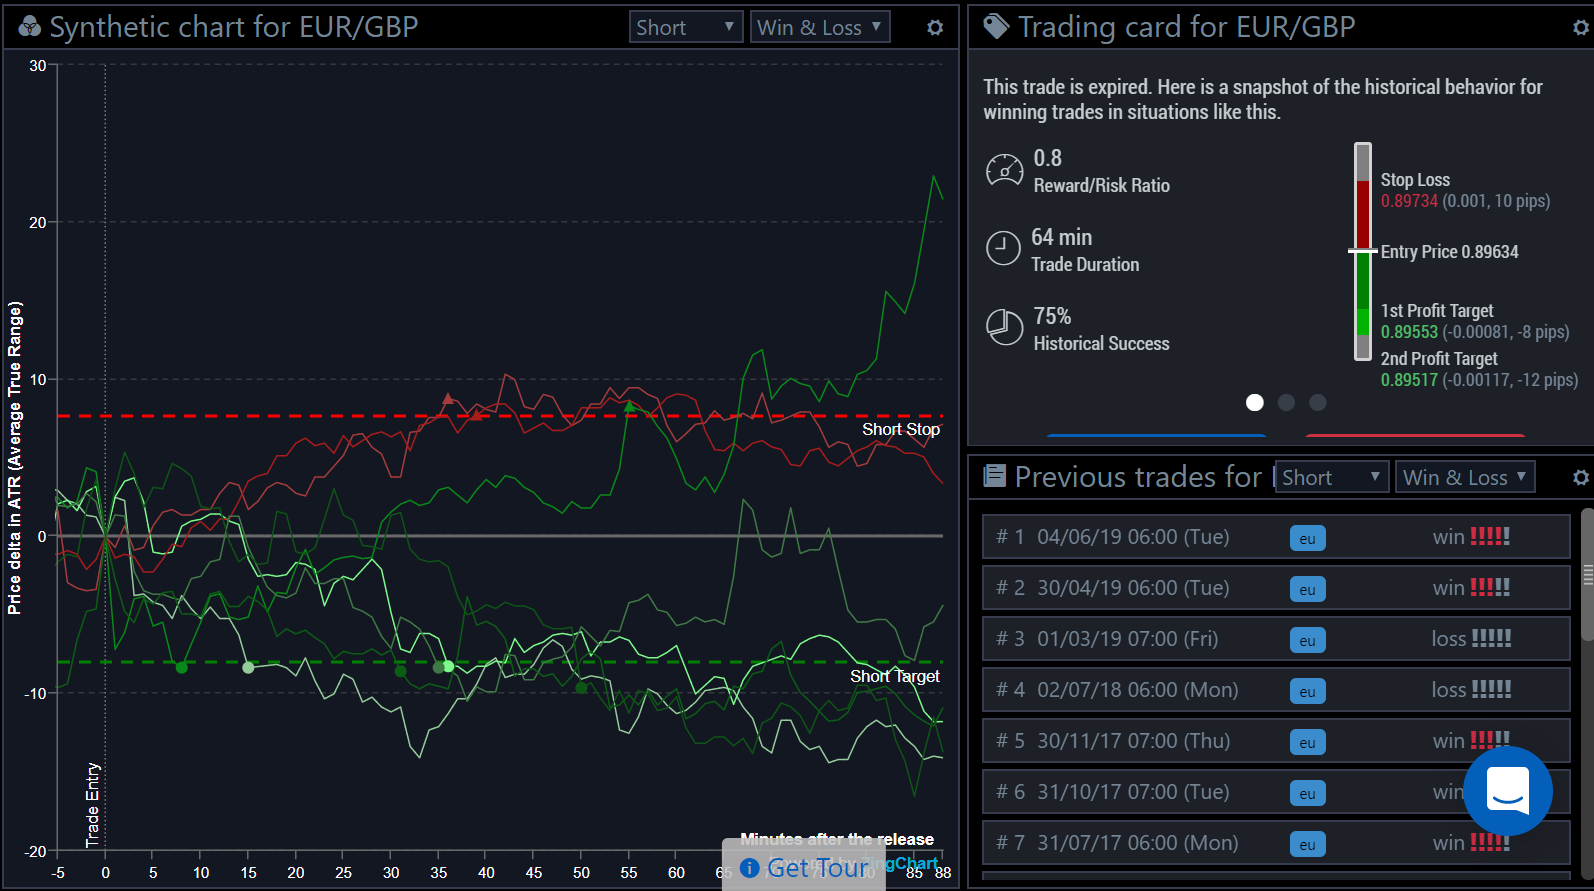 Fig. 9: Backtester in use setup
 Source: BetterTrader.co
The synthetic chart shows the stop loss and profit targets aligned with the past occurrences of the type of event. It allows you to see how often taking this position yielded success as well as how long it took.
This combined information allows you to make an educated decision when placing your trades. If we take the information we gathered and use it against the live chart as it occurred.
After the release
Finally our 4 minutes and 49 seconds are up and the information was released.
 Fig. 10: EUR unemployment release
 Source: BetterTrader.co
When the information was released it was much stronger and the researched shown above proved to be useful. The BackTester showed the following trade idea.
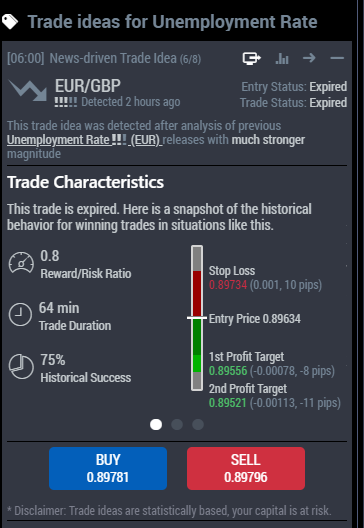 Fig. 11: Eurgbp trade idea
 Source: BetterTrader.co
The trade idea shows a stop loss and profit targets. These values are determined using previous releases so that you can a sense of security in your trade.
 Fig. 12: Eurgbp chart analysis
 Source: BetterTrader.co
As shown above, the short position never reached the suggested stop-loss, which we saw in the BackTester. But the profit target, generated using the same method, was reached. The figure also shows that the position would have reached the profit 53 minutes into opening the position allowing you to close the position and make your profit.
All of this information is available to you with the click of a button and in real-time after the release. Then with another click, you are able to switch to your broker and place your trade.
Read More BetterTrader Case Studies
Back to case studiesThis is what our Pro Membership Clients say about us...
BetterTrader is used extensively by professional traders as well as enthusiastic beginners.
