How Artificial Intelligence Helps You Understand Leading/Following Markets
Leading/Following Markets is a fundamental analysis tool that helps traders decide on the markets that they should trade. In this case study, we will explore the example of the S&P 500 and oil prices to see how market sentiments can impact the Leading/Following principle and how Artificial Intelligence can aid your trading strategy.
Leading/Following Markets is a fundamental analysis tool that helps traders decide on the markets that they should trade. In this case study, we will explore the example of the S&P 500 and oil prices to see how market sentiments can impact ... the Leading/Following principle and how Artificial Intelligence can aid your trading strategy.
1% Increase in Oil Prices
14 Point Change in S&P 500
Overview
The S&P500 is commonly traded throughout the globe, but with over 500 companies and such a wide range of stocks, it can be difficult for traders to predict which factors will impact the overall index. Take oil prices for example. ExxonMobil, one of the world’s largest publicly-traded international oil and gas company is the 10th most heavily-weighted company in the S&P 500, with a weightage of 1.3%. Thus, a shift in oil prices often results in a rise or fall of the S&P 500. In this case study, we will explore the impact of a rise in West Texas Oil prices on the S&P 500. Fig. 1 (click to enlarge the image) shows the price of oil and S&P 500 from 2018 to 2019.
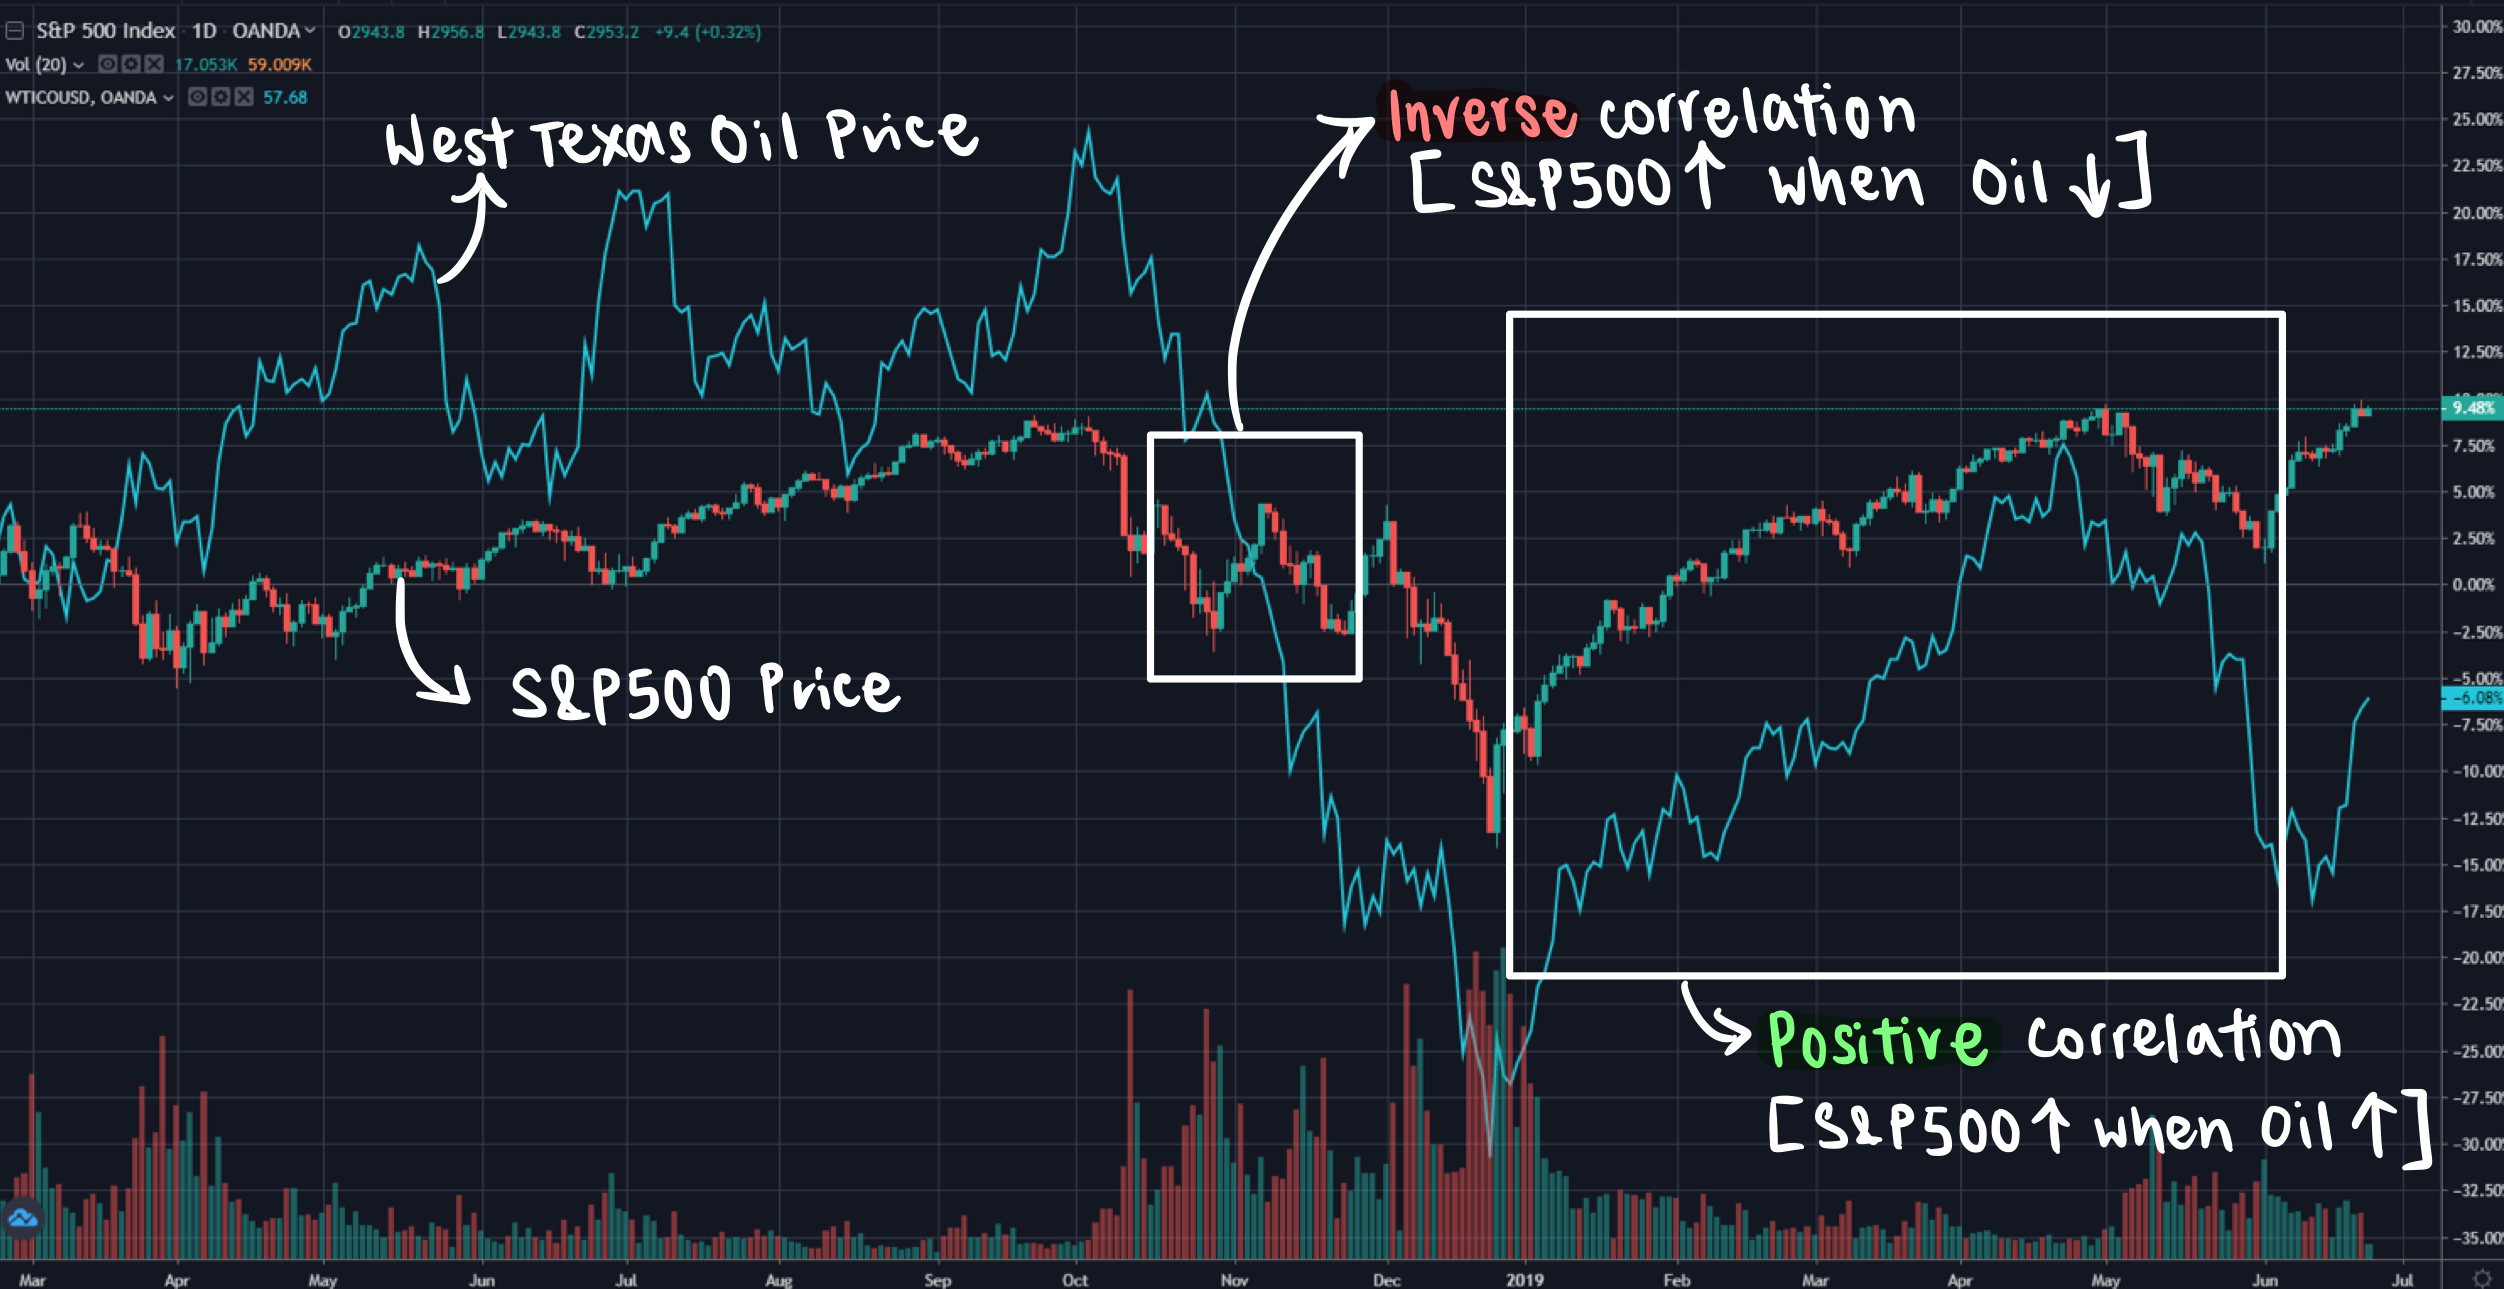 Fig. 1: Oil and S&P 500 prices, 2018-2019
 Source: Trading View
The Problem
As you can see, the volatility of both oil and the S&P 500 is high, with prices rising and falling sporadically. At first glance, we can tell that there is some degree of correlation between the two markets. However, there are two problems here. Firstly, this graph alone does not tell us which instrument is the leader, and which is the follower. According to the principle of Leading and Following markets, when a change in the price of one instrument affects the price of another instrument, they are leading and following instruments. The instrument which moves first is the leader, and the other is the follower. For instance, if OIL is the leader, and the S&P 500 is the follower, traders would want to buy or sell the S&P 500 according to how OIL prices move.
Trading by using leading and following markets entails lower risk because it does not involve prediction. Instead, it identifies recent patterns and correlations to find leading and following markets. The next time a leading market moves, a trader can expect the reaction of the following market, and act on that information.
Next, it is difficult to ascertain the type of correlation i.e. whether the two are positively or inversely correlated with one another. This issue is related to the market sentiment, which is the aggregate approach of all traders in the market.
The Situation
West Texas Oil increased by 1% in 60 minutes (see Fig. 2, click to enlarge the image). In the following 117 minutes, the S&P 500 increased by 14 points. This is a classic leader and follower situation.
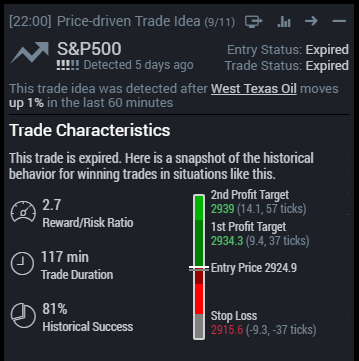 Fig. 2: Trading Card for S&P 500
 Source: BetterTrader
The rising price of oil could create two possible market sentiments. Firstly, the increase in the price of oil could translate to higher production costs for companies in terms of fuel and electricity. Living costs for consumers also rise. As such, firms and consumers have less money available to spend on consumption and investments (stocks, indices etc.). Thus, the S&P 500 is likely to go down.
On the other hand, a high oil price could also signal high demand for oil which often correlates to higher economic growth. When the business outlook is positive, a risk-on environment forms and investors are more likely to invest in riskier assets like the S&P 500. Hence, the S&P 500 is likely to go up.
The problem here is that most traders would not know which of the two cases would actually play out. It is difficult to stay up-to-date with market sentiments and traders may find themselves unsure of the direction that the S&P 500 will move in when there is a change in oil price.
Our Solution
When West Texas Oil increased 1% in 60 minutes, our AI created a price-driven Trade Idea (see Fig. 3, click to enlarge the image). It analyzed the last 20 times that same situation had happened before. Because the S&P 500 followed the price of West Texas Oil recently, our AI recognized that they have a Leader/Follower relationship. Out of those 20 instances, 12 had a significant impact on the S&P 500. The S&P 500 went up 75% (9 out of 12) of the time. Thus, the trade idea to buy S&P 500 was generated.
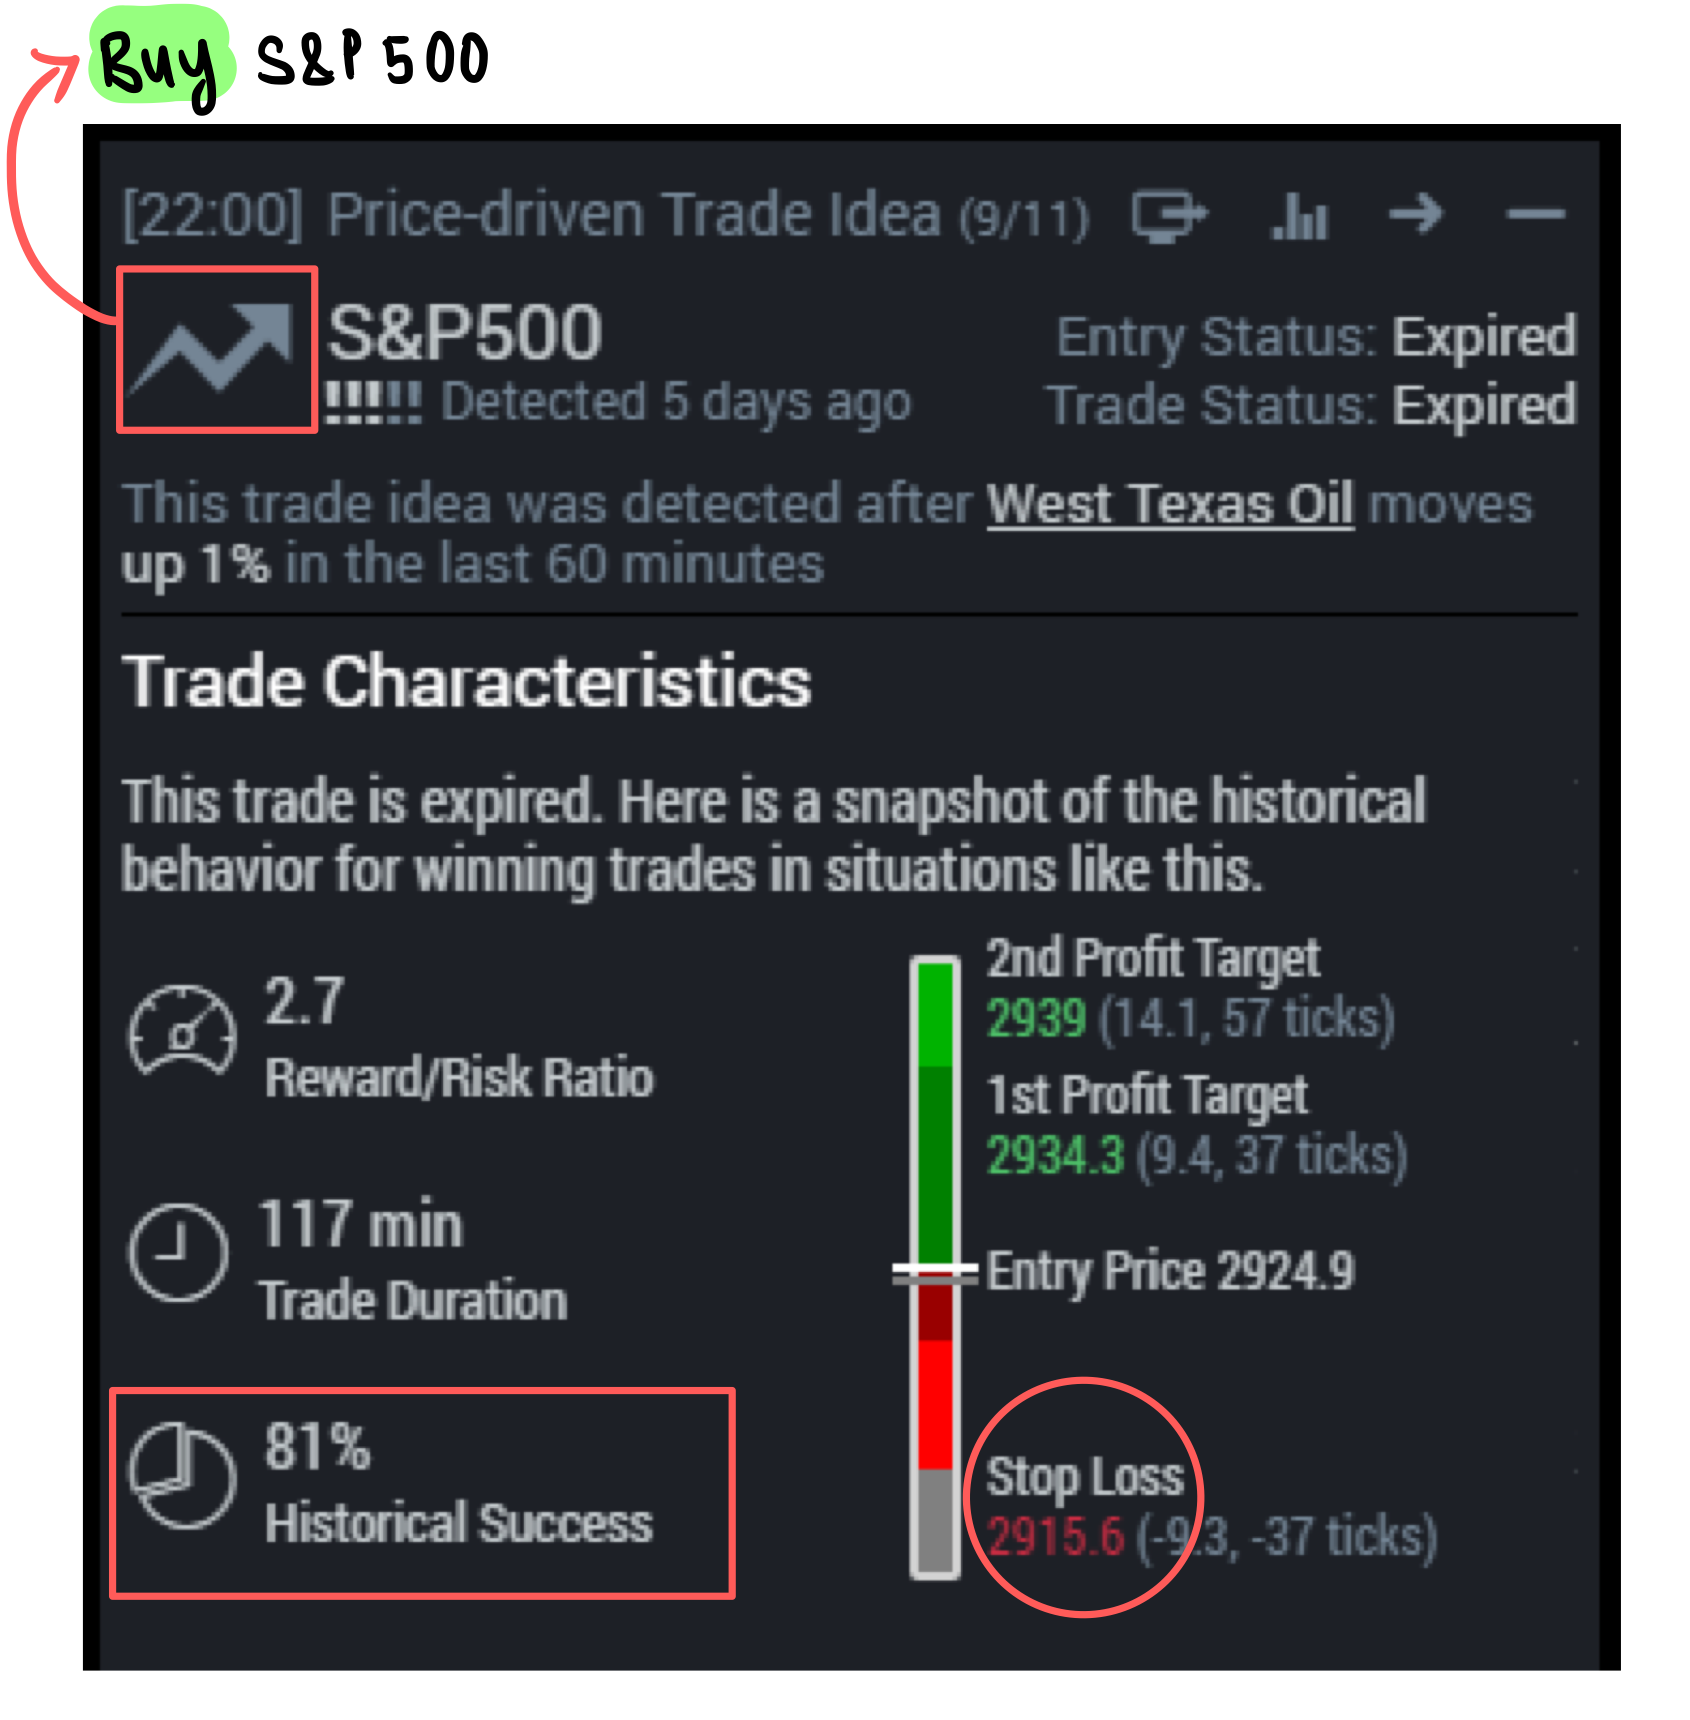 Fig. 3: Trade Idea generated when West Texas Oil increased by 1% in 60 minutes.
 Source: Trade Ideas, BetterTrader
This Trade Idea provides traders with an overview of what they need to know to make a successful trade. Not only does it suggest to buy S&P 500, it gives profit targets and a stop loss price. Furthermore, the Trade Idea is generated seconds after significant movements are detected, providing traders with ample time to react to the follower once the leader moves. Thus, BetterTrader helps set traders up with the necessary mechanics to make a profit.
For The Pros
Sometimes, Trade Ideas are not sufficient for very active traders that trade in large volumes. That’s why we developed the BackTester as a tool for pro traders who want more historical data and to conduct their own trade analysis based on their own insights and experiences. Pro users can run our BackTester to access all the statistics and raw data that go behind creating the Trade Idea generated (see Fig. 4, click to enlarge the image).
BackTesting allows you to devise several trading strategies, maximizing your reaction speed. If the release is “stronger”, you would know to sell the USD/JPY pair, whereas if the release is “weaker”, you would buy Gold. Knowing the average reward times would also help you decide exactly when to buy the USD/JPY pair and sell Gold. Hence, our BackTester gives you the edge you need to profit from economic events, preventing you from going into the trade blind like other traders are.
Besides aiding you in knowing what to trade, our Trade-Ideas let you know when you should not trade something. For instance, the recent release of the NY Empire State Manufacturing Index (June 2019) was “extremely weaker”, meaning it had a very high magnitude of surprise and indicated poor economic performance (see Fig. 7, click to enlarge the image). In this case, our algorithm was unable to devise Trade-Ideas because of a lack of similar releases, seeing as it was the first negative reading in the past 2 years (see Fig. 7, click to enlarge the image). Hence, the advice here is to avoid unfounded speculations and to abstain from trading based on this release.
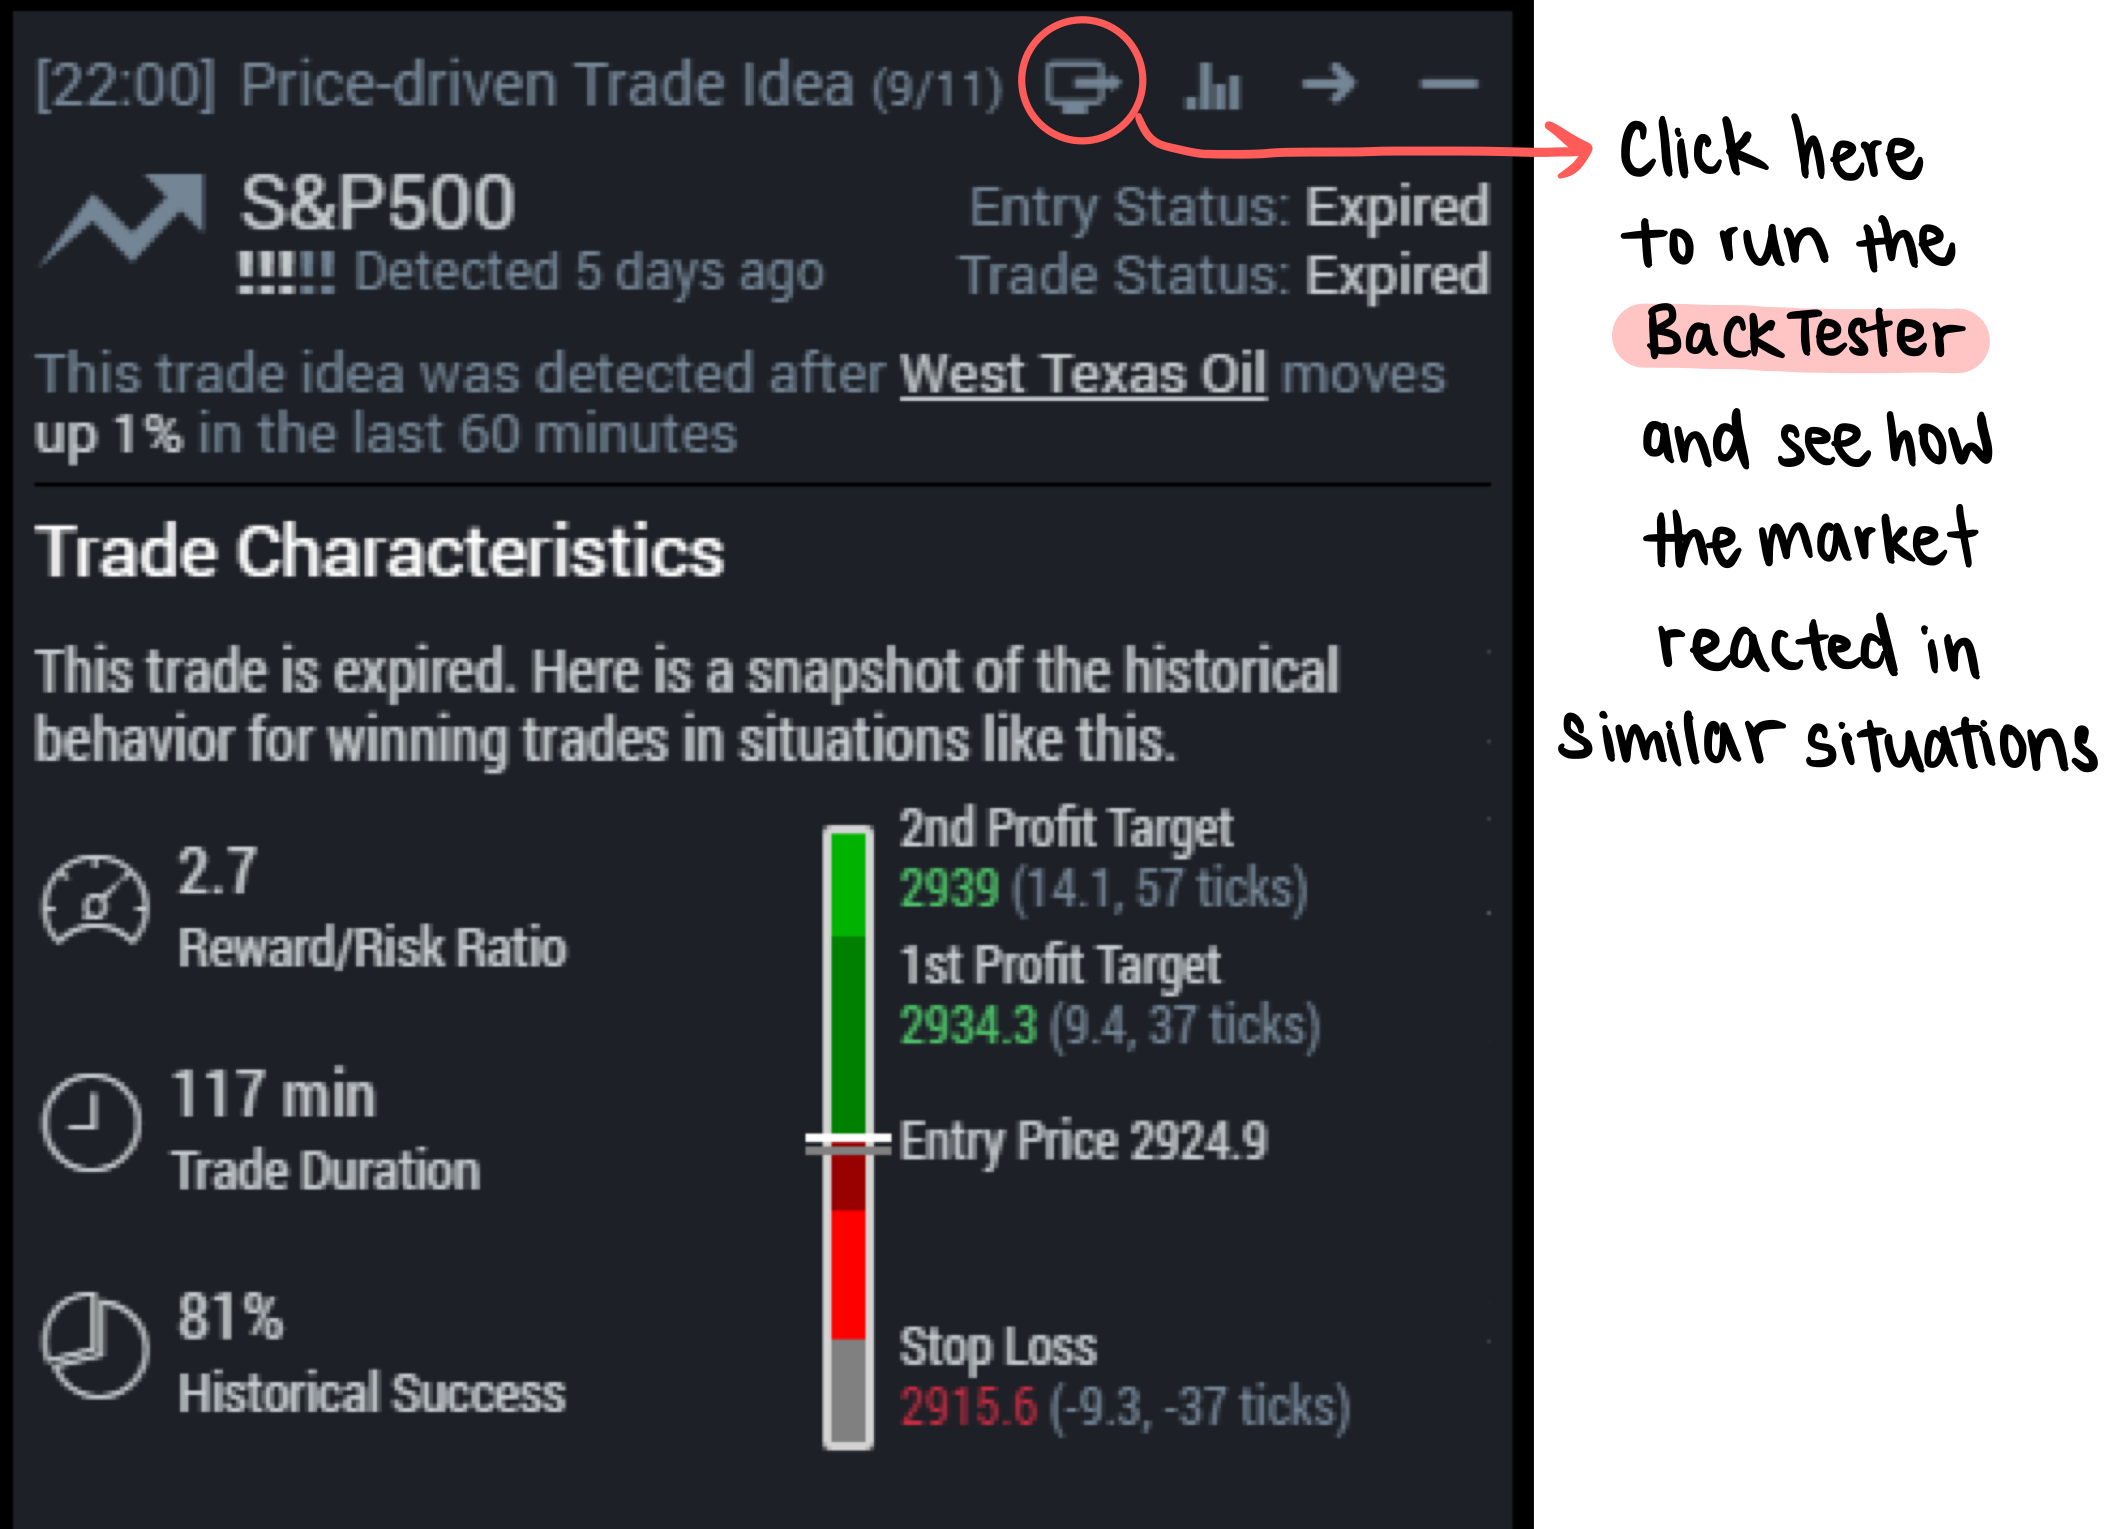 Fig. 4: BackTesting a Trade Idea
 Source: BetterTrader
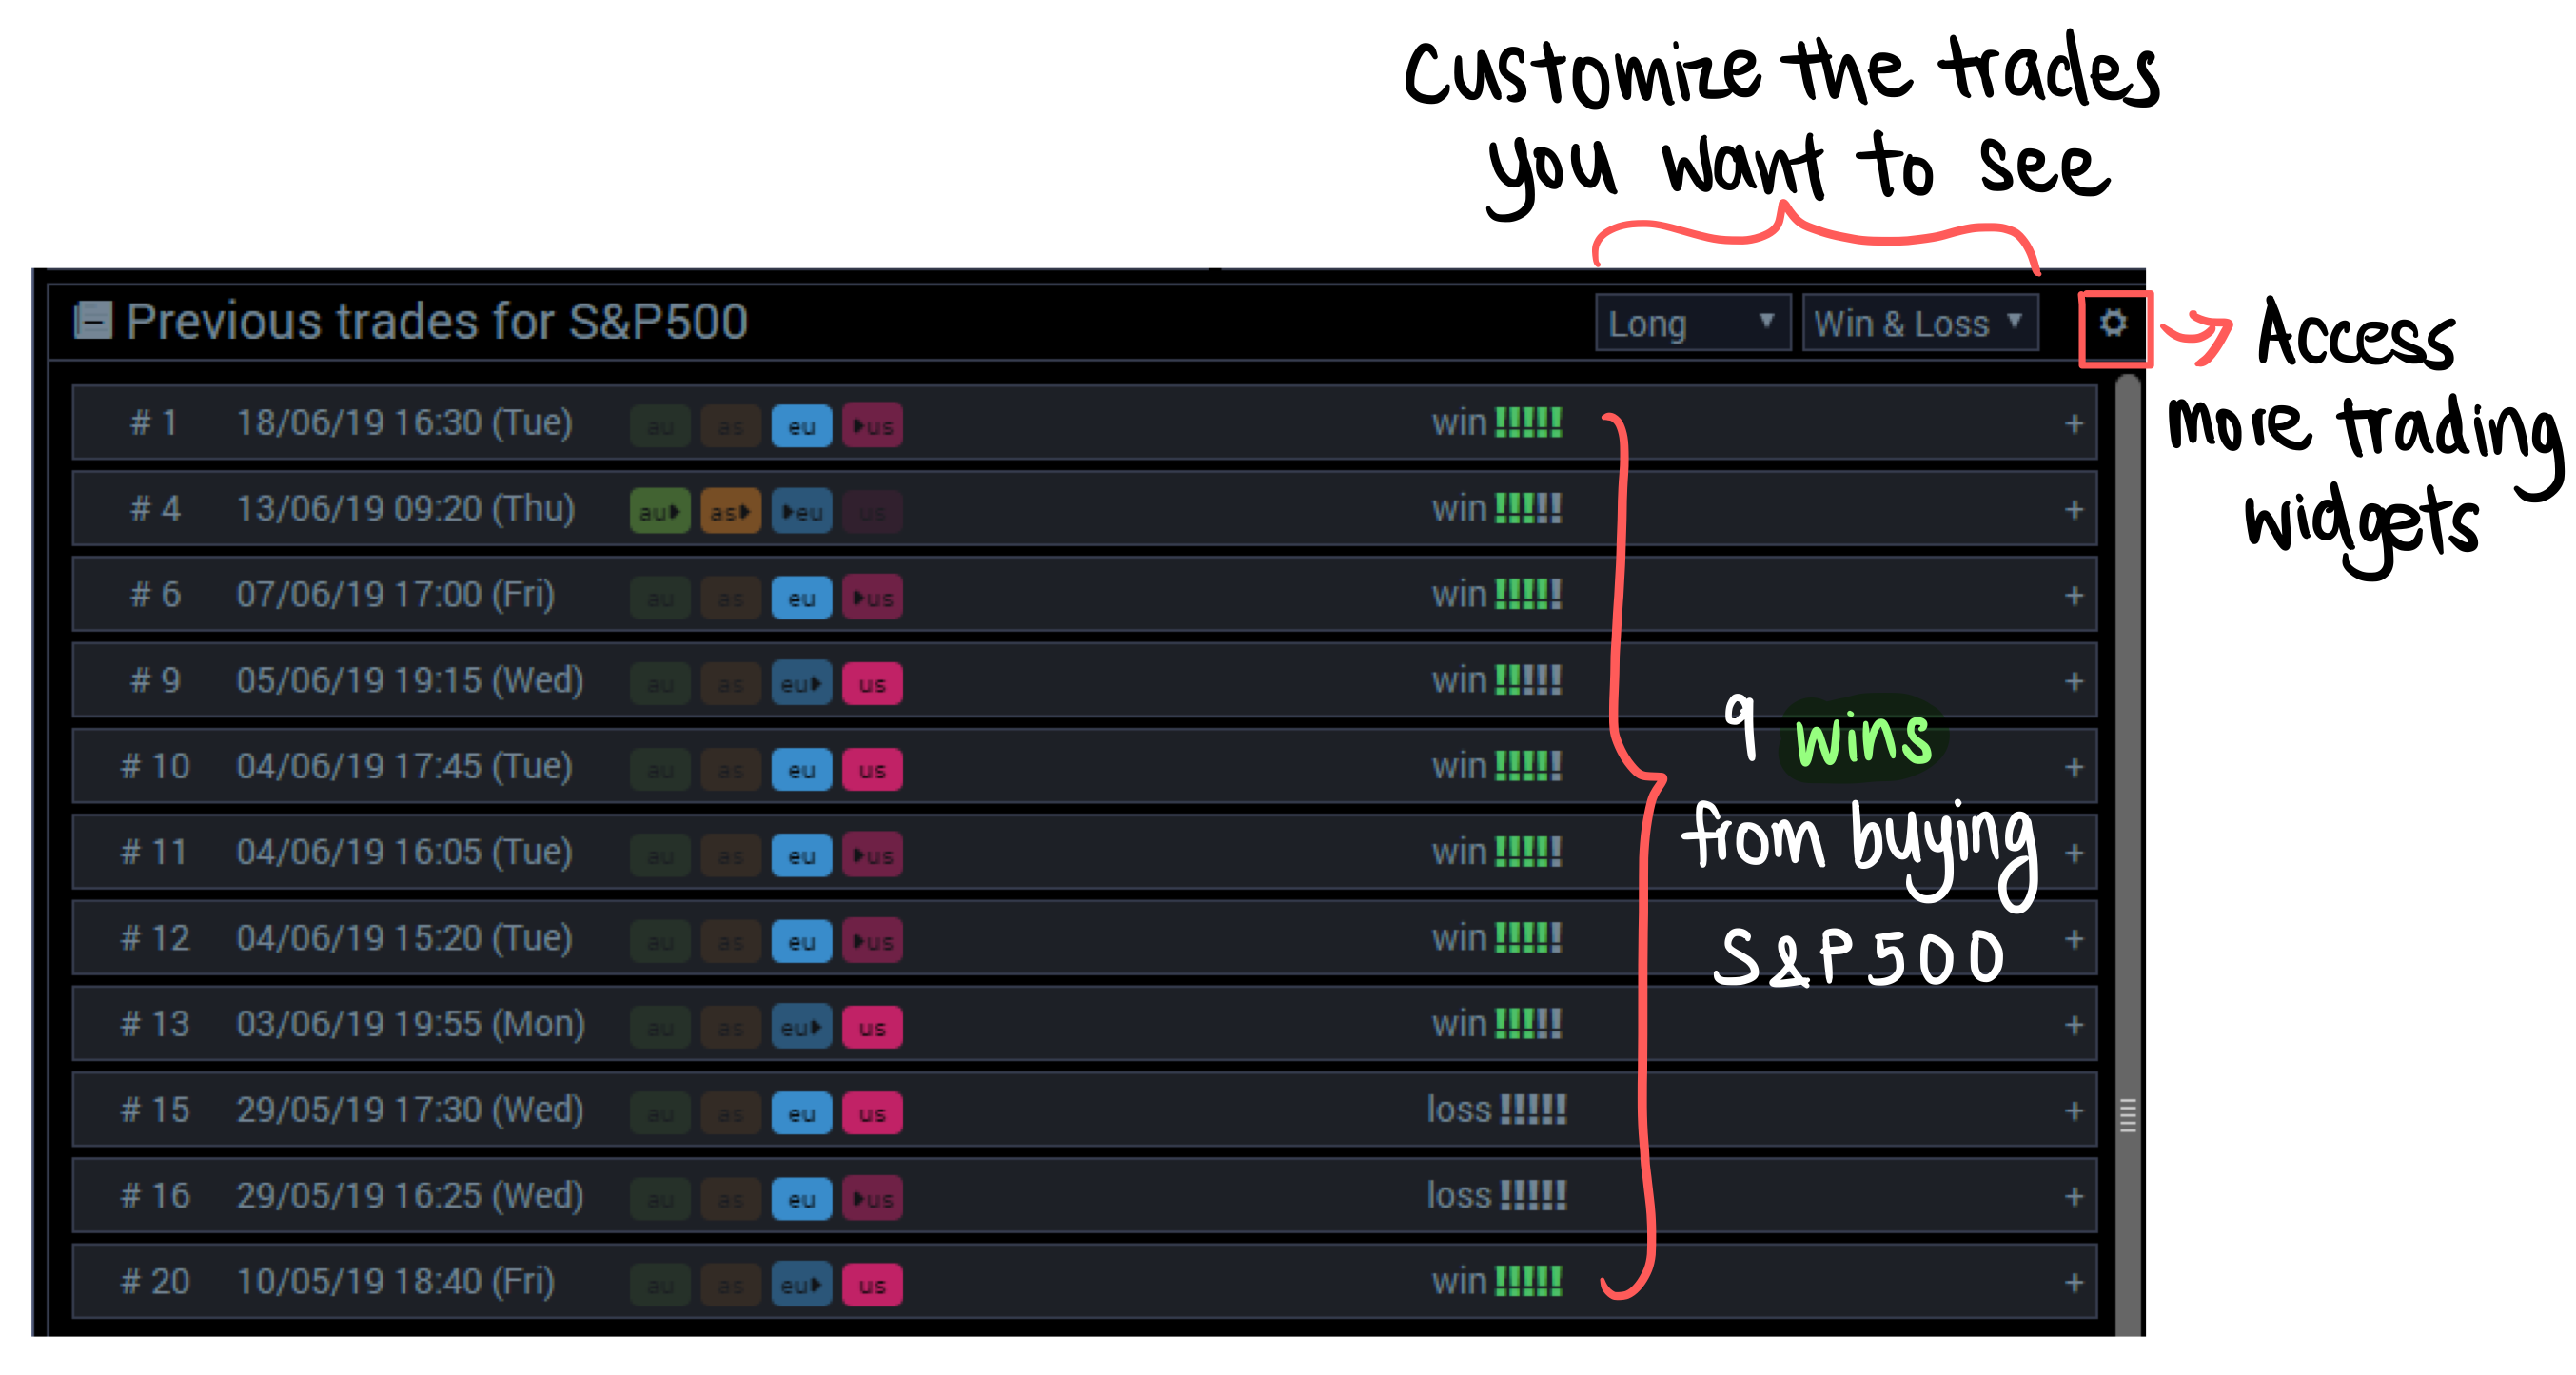
 Fig. 5: BackTester showing the impact of oil prices on S&P 500 in similar past situations
 Source: BackTester, BetterTrader
Fig. 5 (click to enlarge the image) shows the significant trades related to oil prices and the S&P 500 as well as an example of a successful trade. As you can see, the BackTester provides access to in-depth statistical data which can be easily customized to your needs. With this, traders can test out and verify our Trade Ideas as well as test out their own market strategy.
Read More BetterTrader Case Studies
Back to case studiesThis is what our Pro Membership Clients say about us...
BetterTrader is used extensively by professional traders as well as enthusiastic beginners.
