Once we have decided to trade economic events, we need to examine the best way to do so. If the results of an event are stronger than expected, should we take it as a buy? Which asset should we trade for each event? Trading is very complicated today. It’s difficult to buy and sell assets based merely on some pattern on the chart. Today, a successful trader must have an edge.
While trading under pressure, it is not enough to rely on memory and emotions. Interpreting and analyzing data in your mind is not a recipe for success in the high-paced world of day trading. We as traders need a system to rely on when there is no time to research and weigh the risks and benefits of every move. It doesn’t matter if you use a paper system or a computerized system, you just need a system that works for you.
The system we are presenting here is based on data collection, analysis, and probabilistic decision making, eliminating the errors of human logic.
Takeaway
We as traders need a system to rely on when there is no time to research and weigh the risks and benefits of every move. It doesn’t matter if you use a paper system or a computerized system, you just need a system that works for you.

We start our preparation for an economic event 15 minutes before it begins. There are two stages: gathering the basic data and simulation.
Step 1 - Gather The Basic Data
The section describes how we understand the landscape of information for the event we are considering trading.
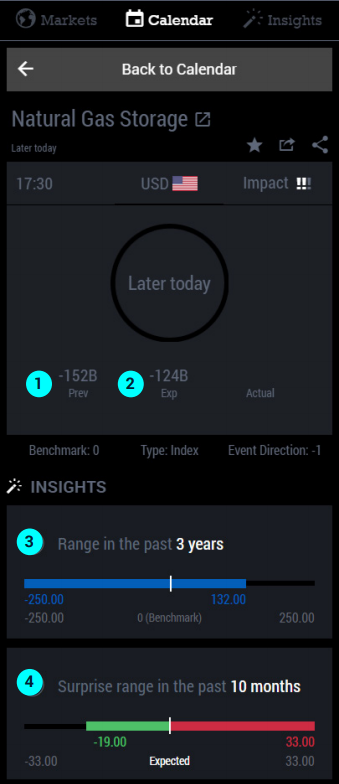
Gathering the basic data in BetterTrader
- Previous release - The actual number from the last week or month of that release
- Expected results - Average expectation of the release
- How to use this: This is the benchmark for the actual release. In general, higher actual than expected is a positive surprise.
- Range - of the actual releases over the time.
- How to use this: As traders we are looking for a break in the pattern. To know the range of releases help us to recognize quickly once the release appears - if that number is out of this range, probably the market will react firmly.
- Surprise range - the range of stronger and weaker releases relative to expectations.
- How to use this: Using the surprise range from the past 10 months, we can see that a negative surprise is much more likely than a positive surprise. This means that if we see a number that is surprising to the positive side, it’s much more sensitive than a number that is surprising to the negative side.

Step 2 – Simulation (or Backtesting)
Now that we understand the landscape, we can prepare to potentially trade the release. We can’t be certain about the future, but as a trader, the historical information is all that you have. You can also use your own experience, your own system that uses what you’ve seen in the past, and what has happened in similar situations.
By backtesting before the release, we can learn what instrument we should trade after the release because we prefer to trade the instrument with the highest correlation with this event.
We can explore the market logic for this specific event using a simulation. We don’t know if the results will be negative, positive, or as expected, but using the simulation, we can determine what the best trading strategy would be for each of the three possibilities. This allows us to have a clear idea of how to capitalize on each situation, and trade calmly and efficiently rather than panicking after an unexpected result.


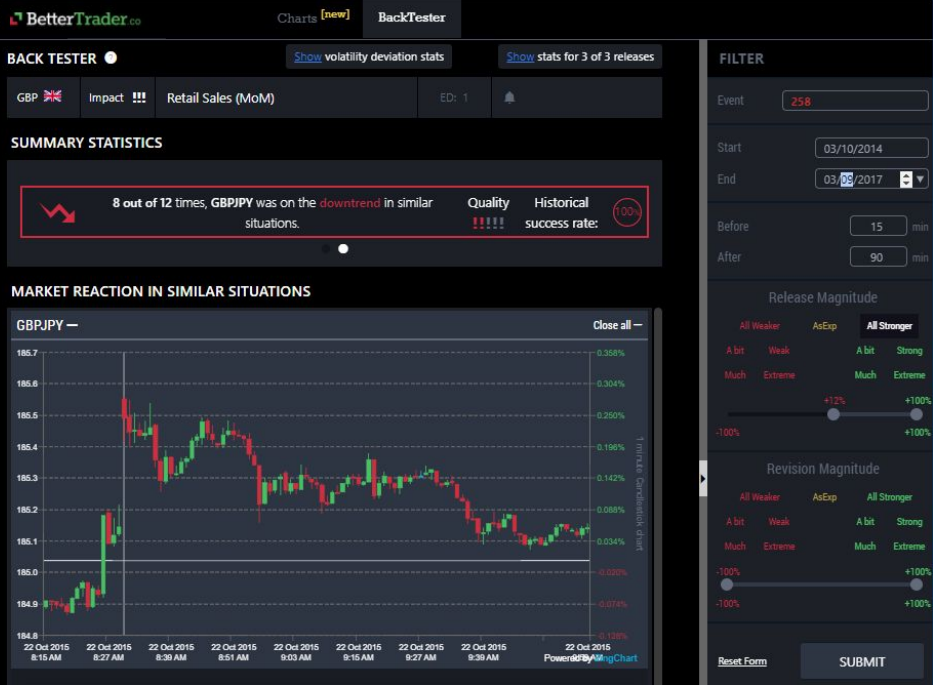
Let’s use Retail Sales in England as an example. The event is going to be released soon, but we don’t know what the release will be. Will it be positive? Negative? We can prepare by simulating the market reaction in pre-set situations. We can simulate a positive or negative release, a bit positive, very surprisingly positive, etc.
Next, we will want to know how other markets will react to the release. Some of the big ones that we look at include currencies, the stock index, OIL, Natural Gas, and GOLD. What you see here is a simulation about the positive surprise in relation to Retail Sales in the past 3 years. Here is the simulation, 15 minutes before the release until 90 minutes after.

Using the 12 charts given, we can see that among all the data from the last 3 years, out of 36 releases, only 12 were stronger (meaning that retail sales increased significantly). You can see that 8 out of those 12 times the GBPJPY began a downtrend following stronger Retail sales . So if this release is positive, we now know what to trade: GBPJPY.
The same approach can be used with negative releases to get some idea about what instruments are correlated and in which direction.


